Pressure vs Temperature
Surfinpy has the functionality to generate phase diagrams as a function of pressure vs temperature based upon the methodology used in Molinari et al. (J. Phys. Chem. C 116, 12, 7073-7082) according to
\[\gamma_{adsorbed, T, P} = \gamma_{bare} + ( C ( E_{ads, T} - RTln(\frac{p}{p^o})\]
where \(\gamma_{adsorbed, T, p}\) is the surface energy of the surface with adsorbed species at temperature (T) and pressure (P), \(\gamma_{bare}\) is the suface energy of the bare surface, C is the coverage of adsorbed species, \(E_{ads}\) is the adsorption energy,
\[E_{ads, T} = E_{slab, adsorbant} - (E_{slab, bare} + n_{H_2O} E_{H_2O, T}) / n_{H_2O}\]
where \(E_{slab, adsorbant}\) is the energy of the surface and the adsorbed species, \(n_{H_2O}\) is he number of adsorbed species,
\[E_{H_2O, (T)} = E_{H_2O, (g)} - TS_{(T)}\]
where \(S_{(T)}\) is the experimental entropy of gaseous water in the standard state.
Usage
from surfinpy import utils as ut
from surfinpy import p_vs_t
adsorbant = -14.00
SE = 1.40
stoich = {'Cation': 24, 'X': 48, 'Y': 0, 'Area': 60.22,
'Energy': -575.00, 'Label': 'Bare'}
H2O = {'Cation': 24, 'X': 48, 'Y': 2, 'Area': 60.22,
'Energy': -605.00, 'Label': '1 Water'}
H2O_2 = {'Cation': 24, 'X': 48, 'Y': 8, 'Area': 60.22,
'Energy': -695.00, 'Label': '2 Water'}
data = [H2O, H2O_2]
coverage = ut.calculate_coverage(data)
thermochem = ut.read_nist("H2O.txt")
system = p_vs_t.calculate(stoich, data, SE,
adsorbant,
thermochem,
coverage)
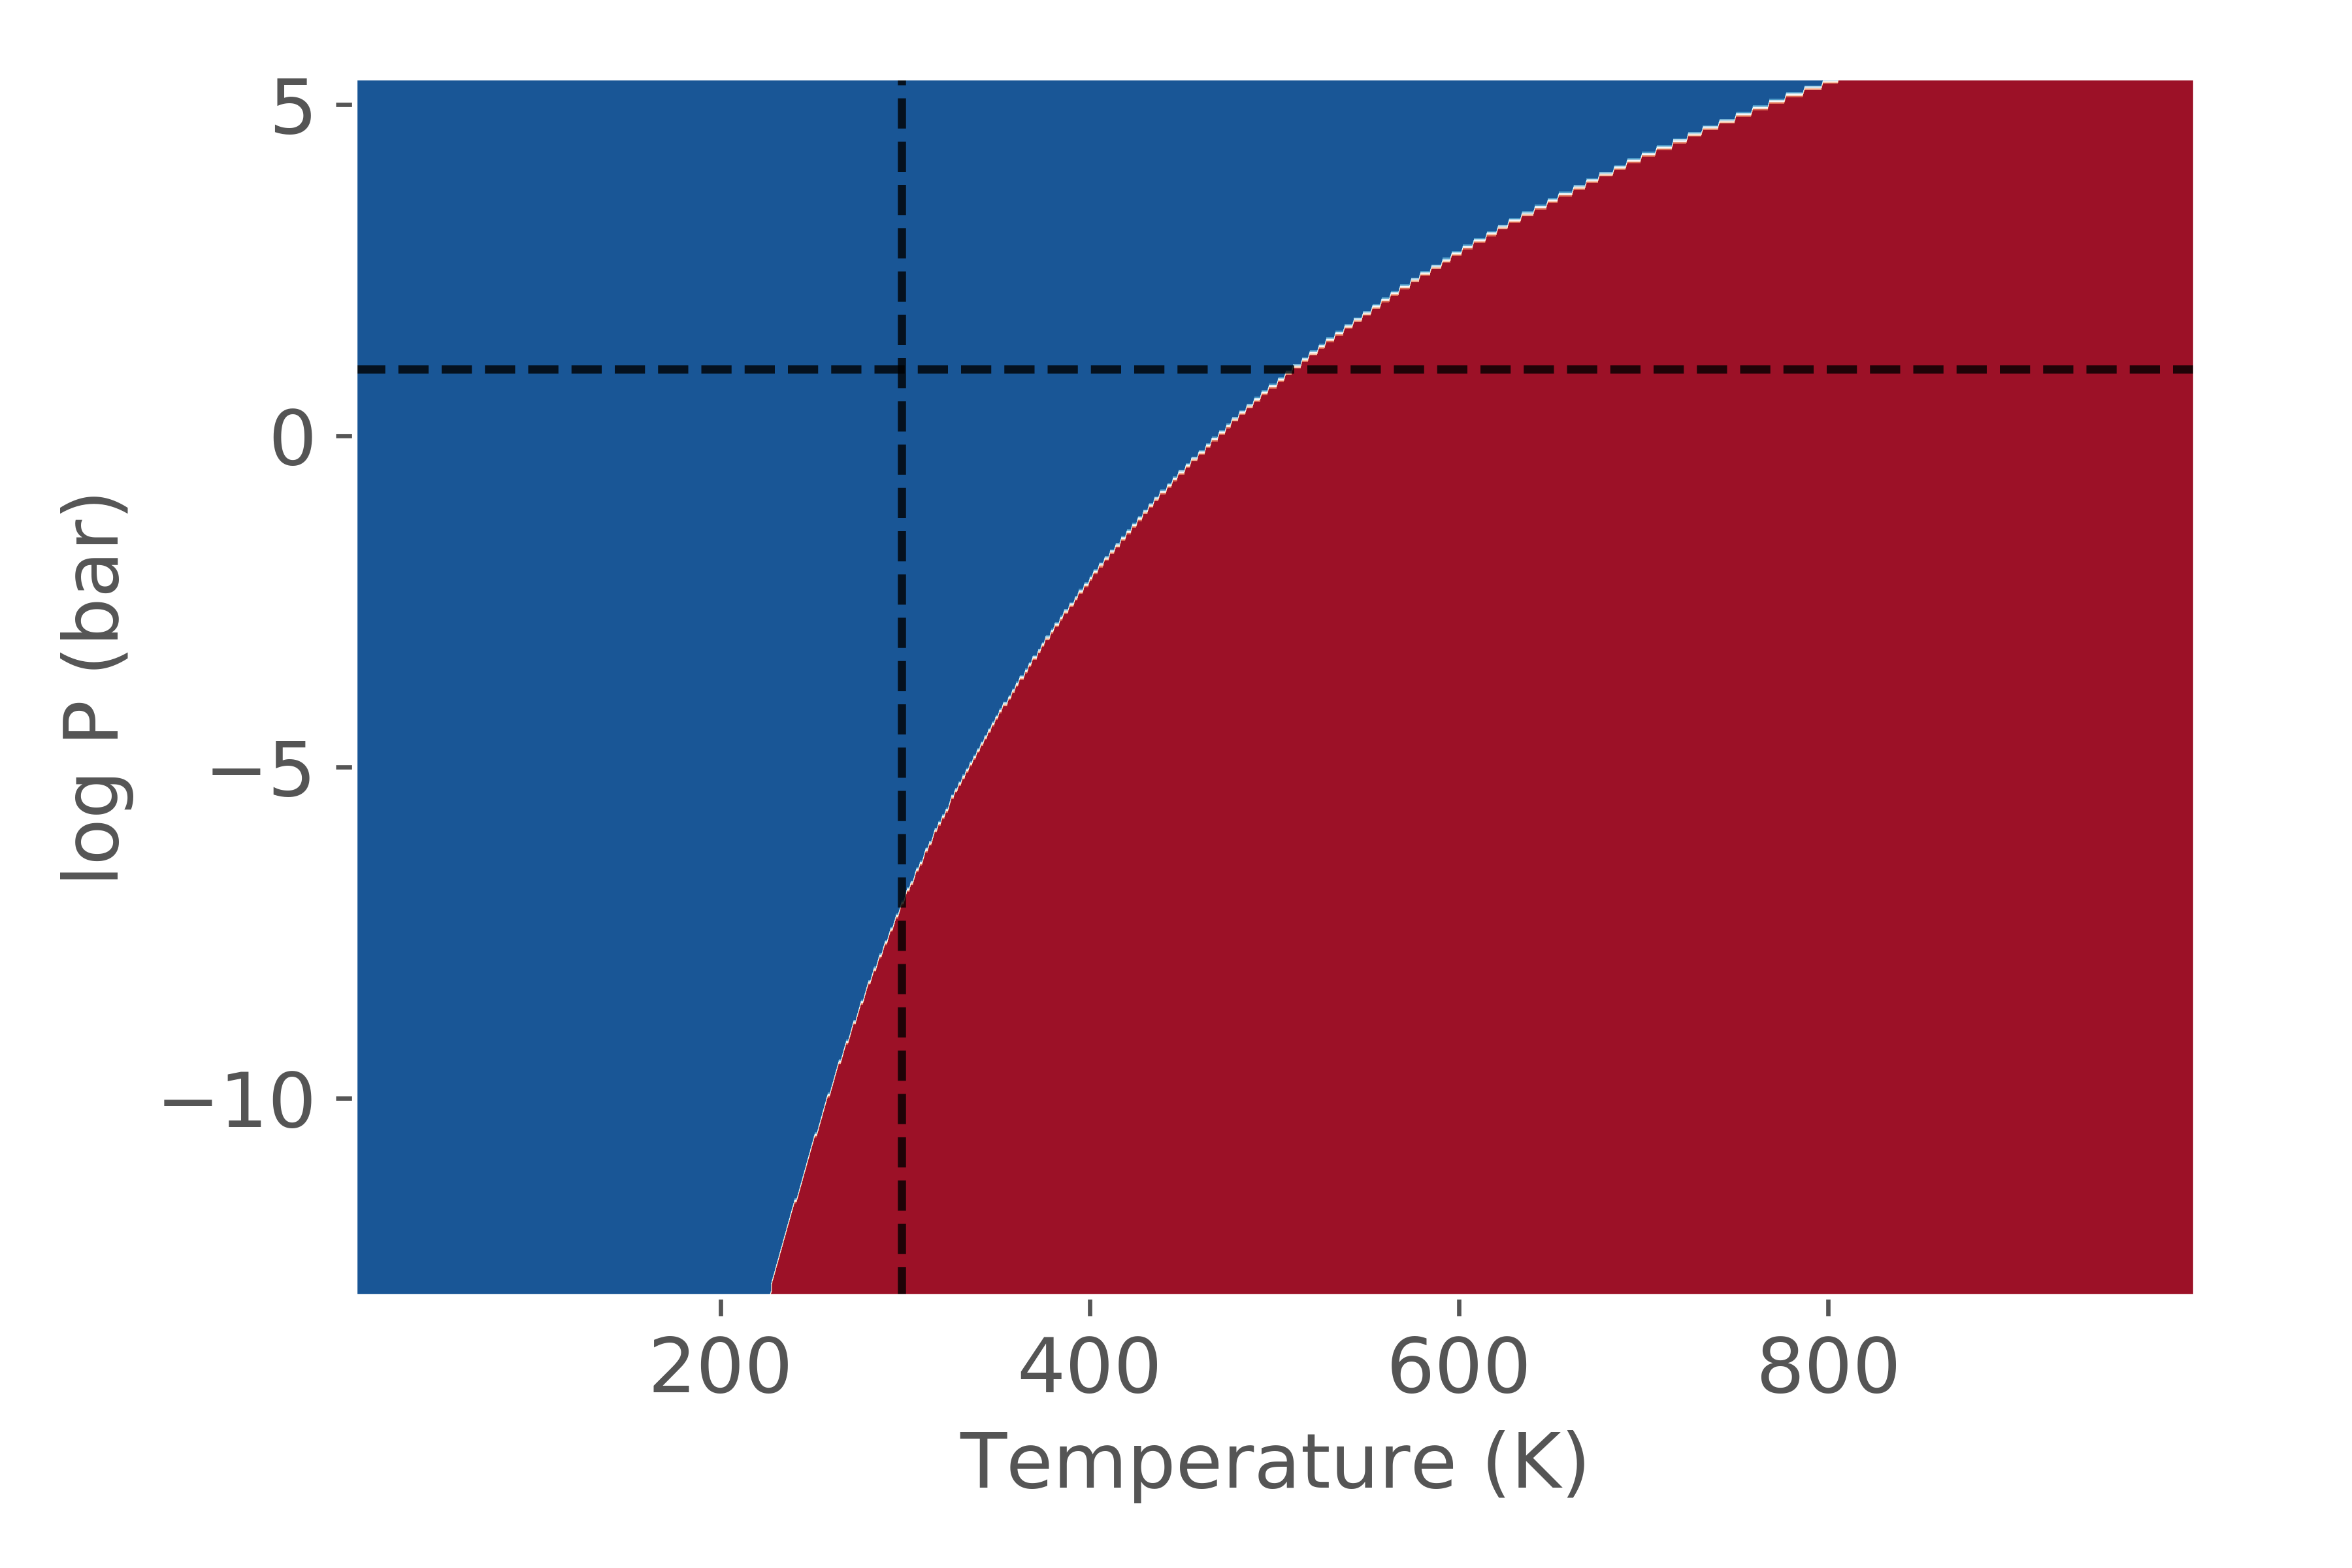
system.plot()
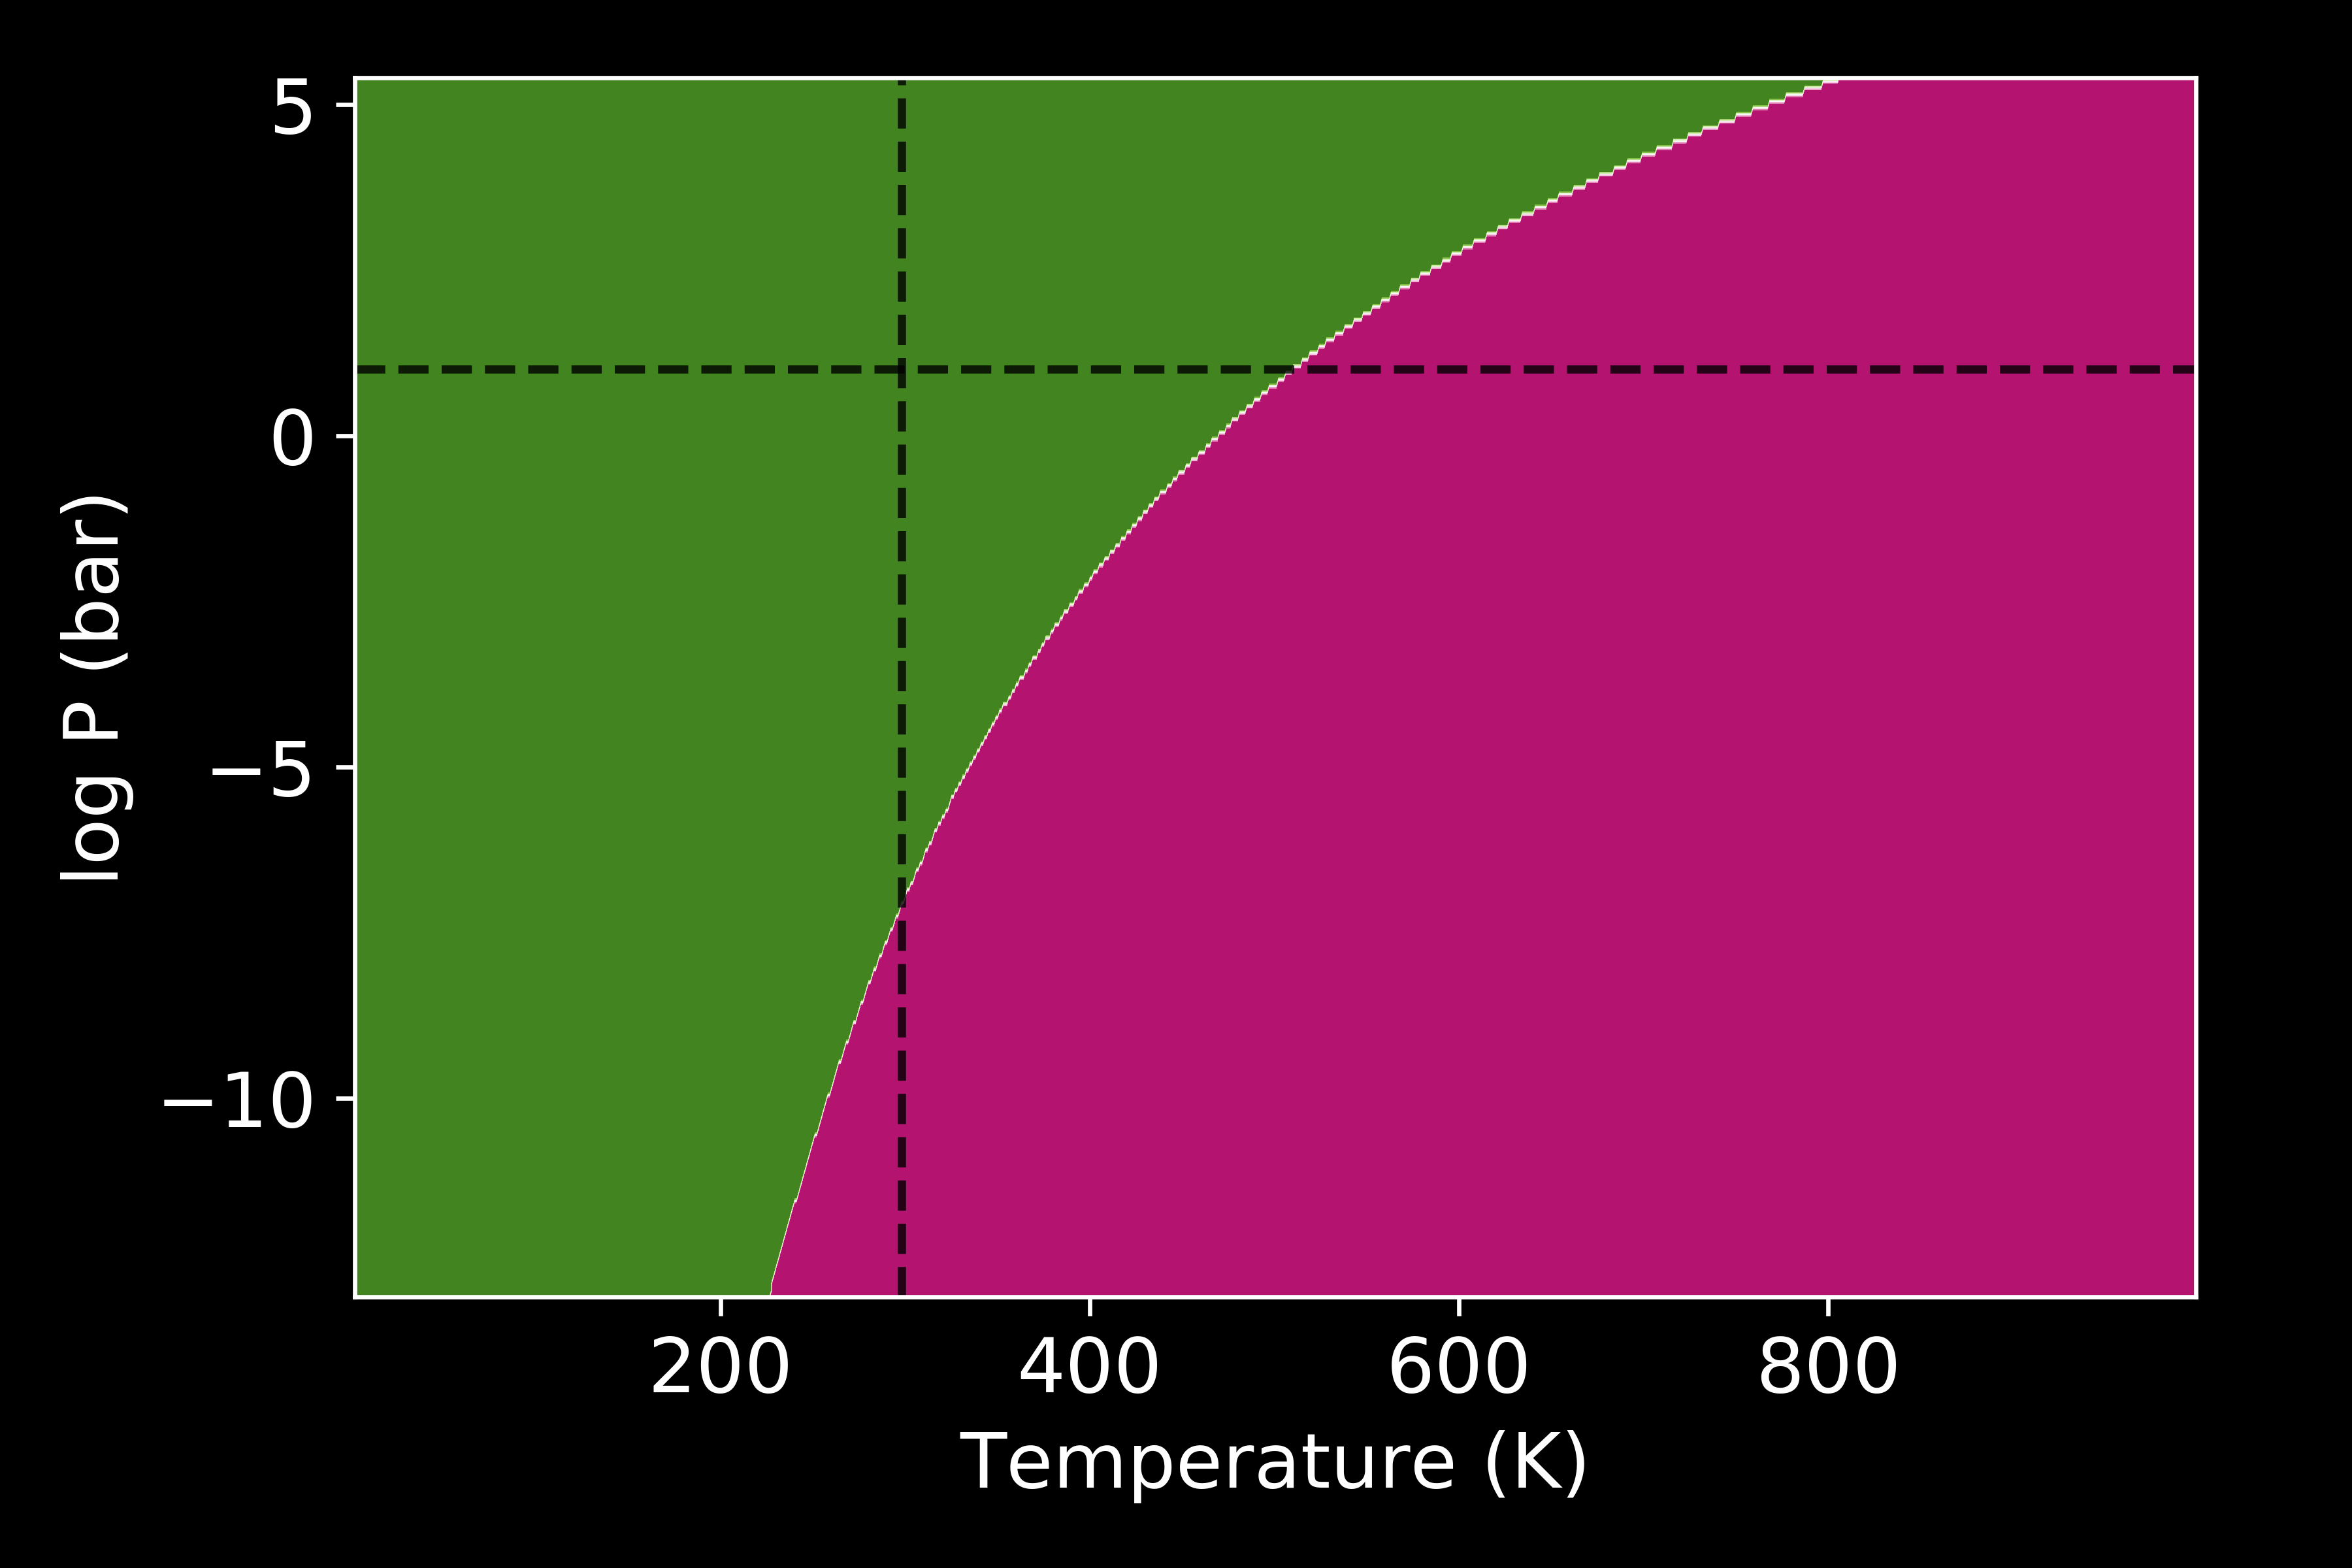
Alternatively you can also tweak the style
system.plot(output="dark_pvt.png",
            set_style="dark_background",
            colourmap="PiYG")