Pressure vs Temperature
Surfinpy has the functionality to generate phase diagrams as a function of pressure vs temperature based upon the methodology used in Molinari et al according to
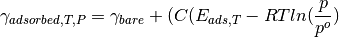
where  is the surface energy of the surface with adsorbed species at temperature (T) and pressure (P),
 is the suface energy of the bare surface, C is the coverage of adsorbed species,
  is the adsorption energy,

where  is the energy of the surface and the adsorbed species,
  is he number of adsorbed species,

where  is the experimental entropy of gaseous water in the standard state.
Usage
from surfinpy import utils as ut
from surfinpy import p_vs_t
adsorbant = -14.00
SE = 1.40
stoich = {'Cation': 24, 'X': 48, 'Y': 0, 'Area': 60.22,
'Energy': -575.00, 'Label': 'Bare'}
H2O = {'Cation': 24, 'X': 48, 'Y': 2, 'Area': 60.22,
'Energy': -605.00, 'Label': '1 Water'}
H2O_2 = {'Cation': 24, 'X': 48, 'Y': 8, 'Area': 60.22,
'Energy': -695.00, 'Label': '2 Water'}
data = [H2O, H2O_2]
coverage = ut.calculate_coverage(data)
thermochem = ut.read_nist("H2O.txt")
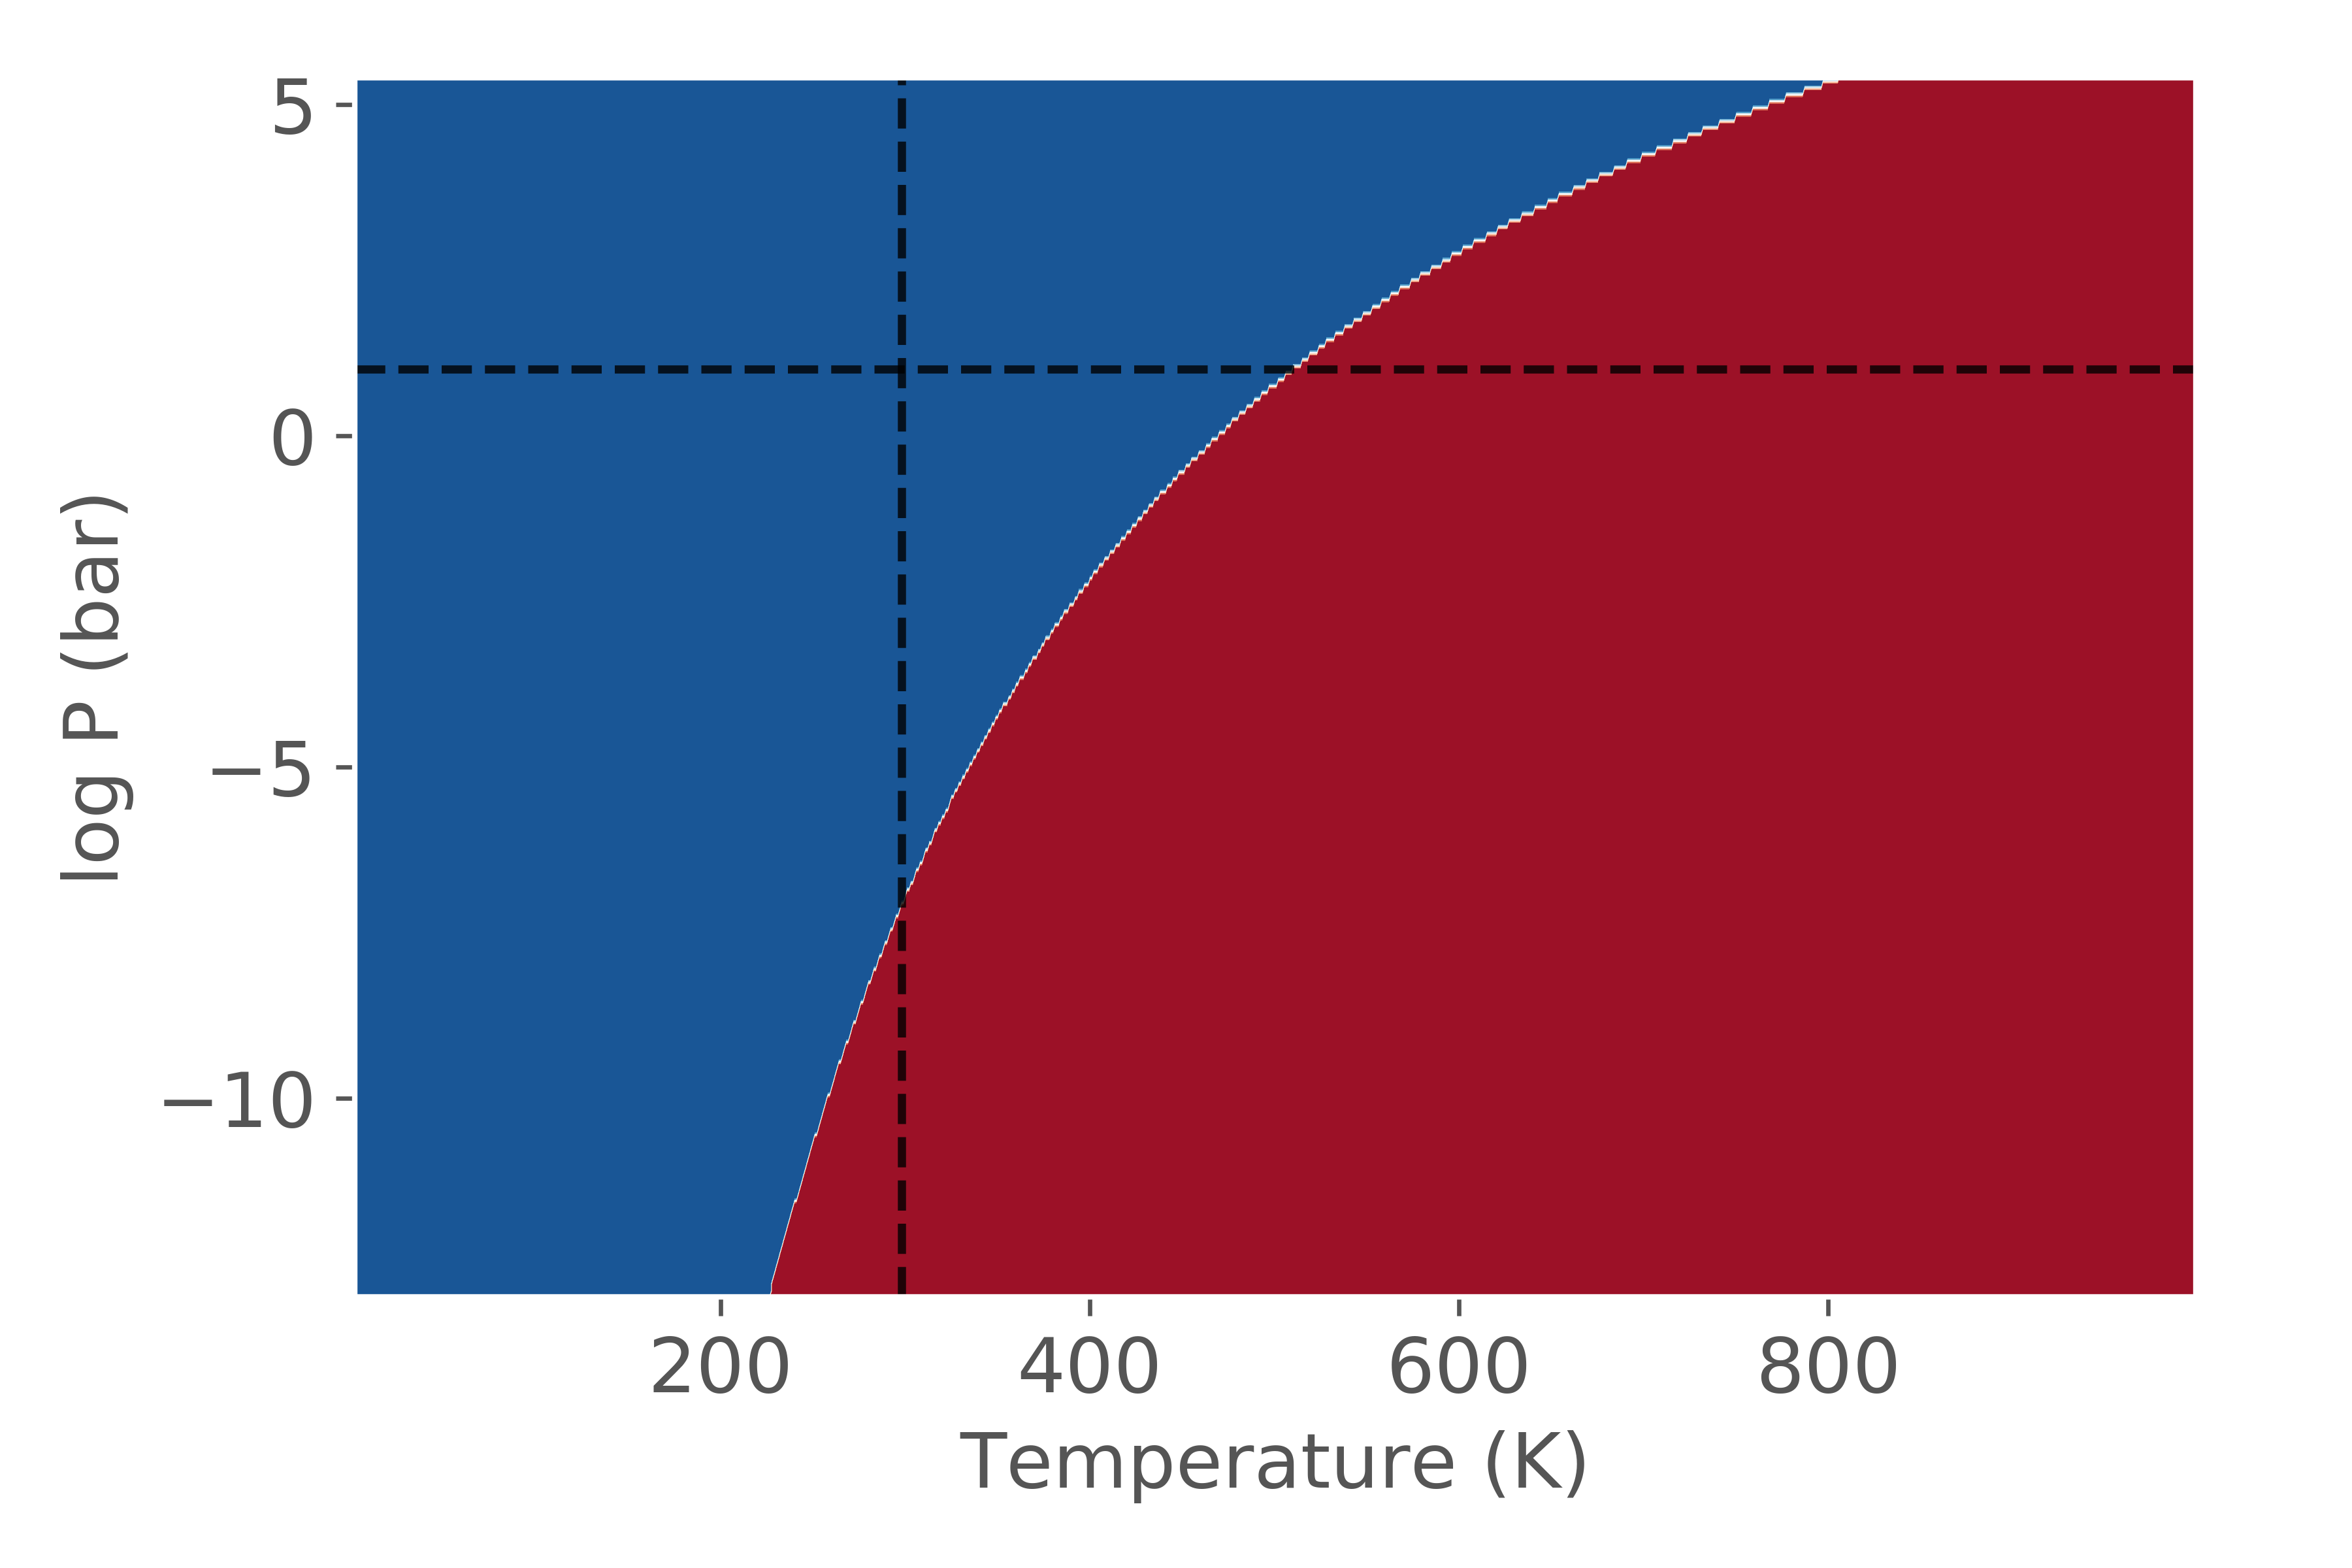
system = p_vs_t.calculate(stoich, data, SE,
adsorbant,
thermochem,
coverage)
system.plot()
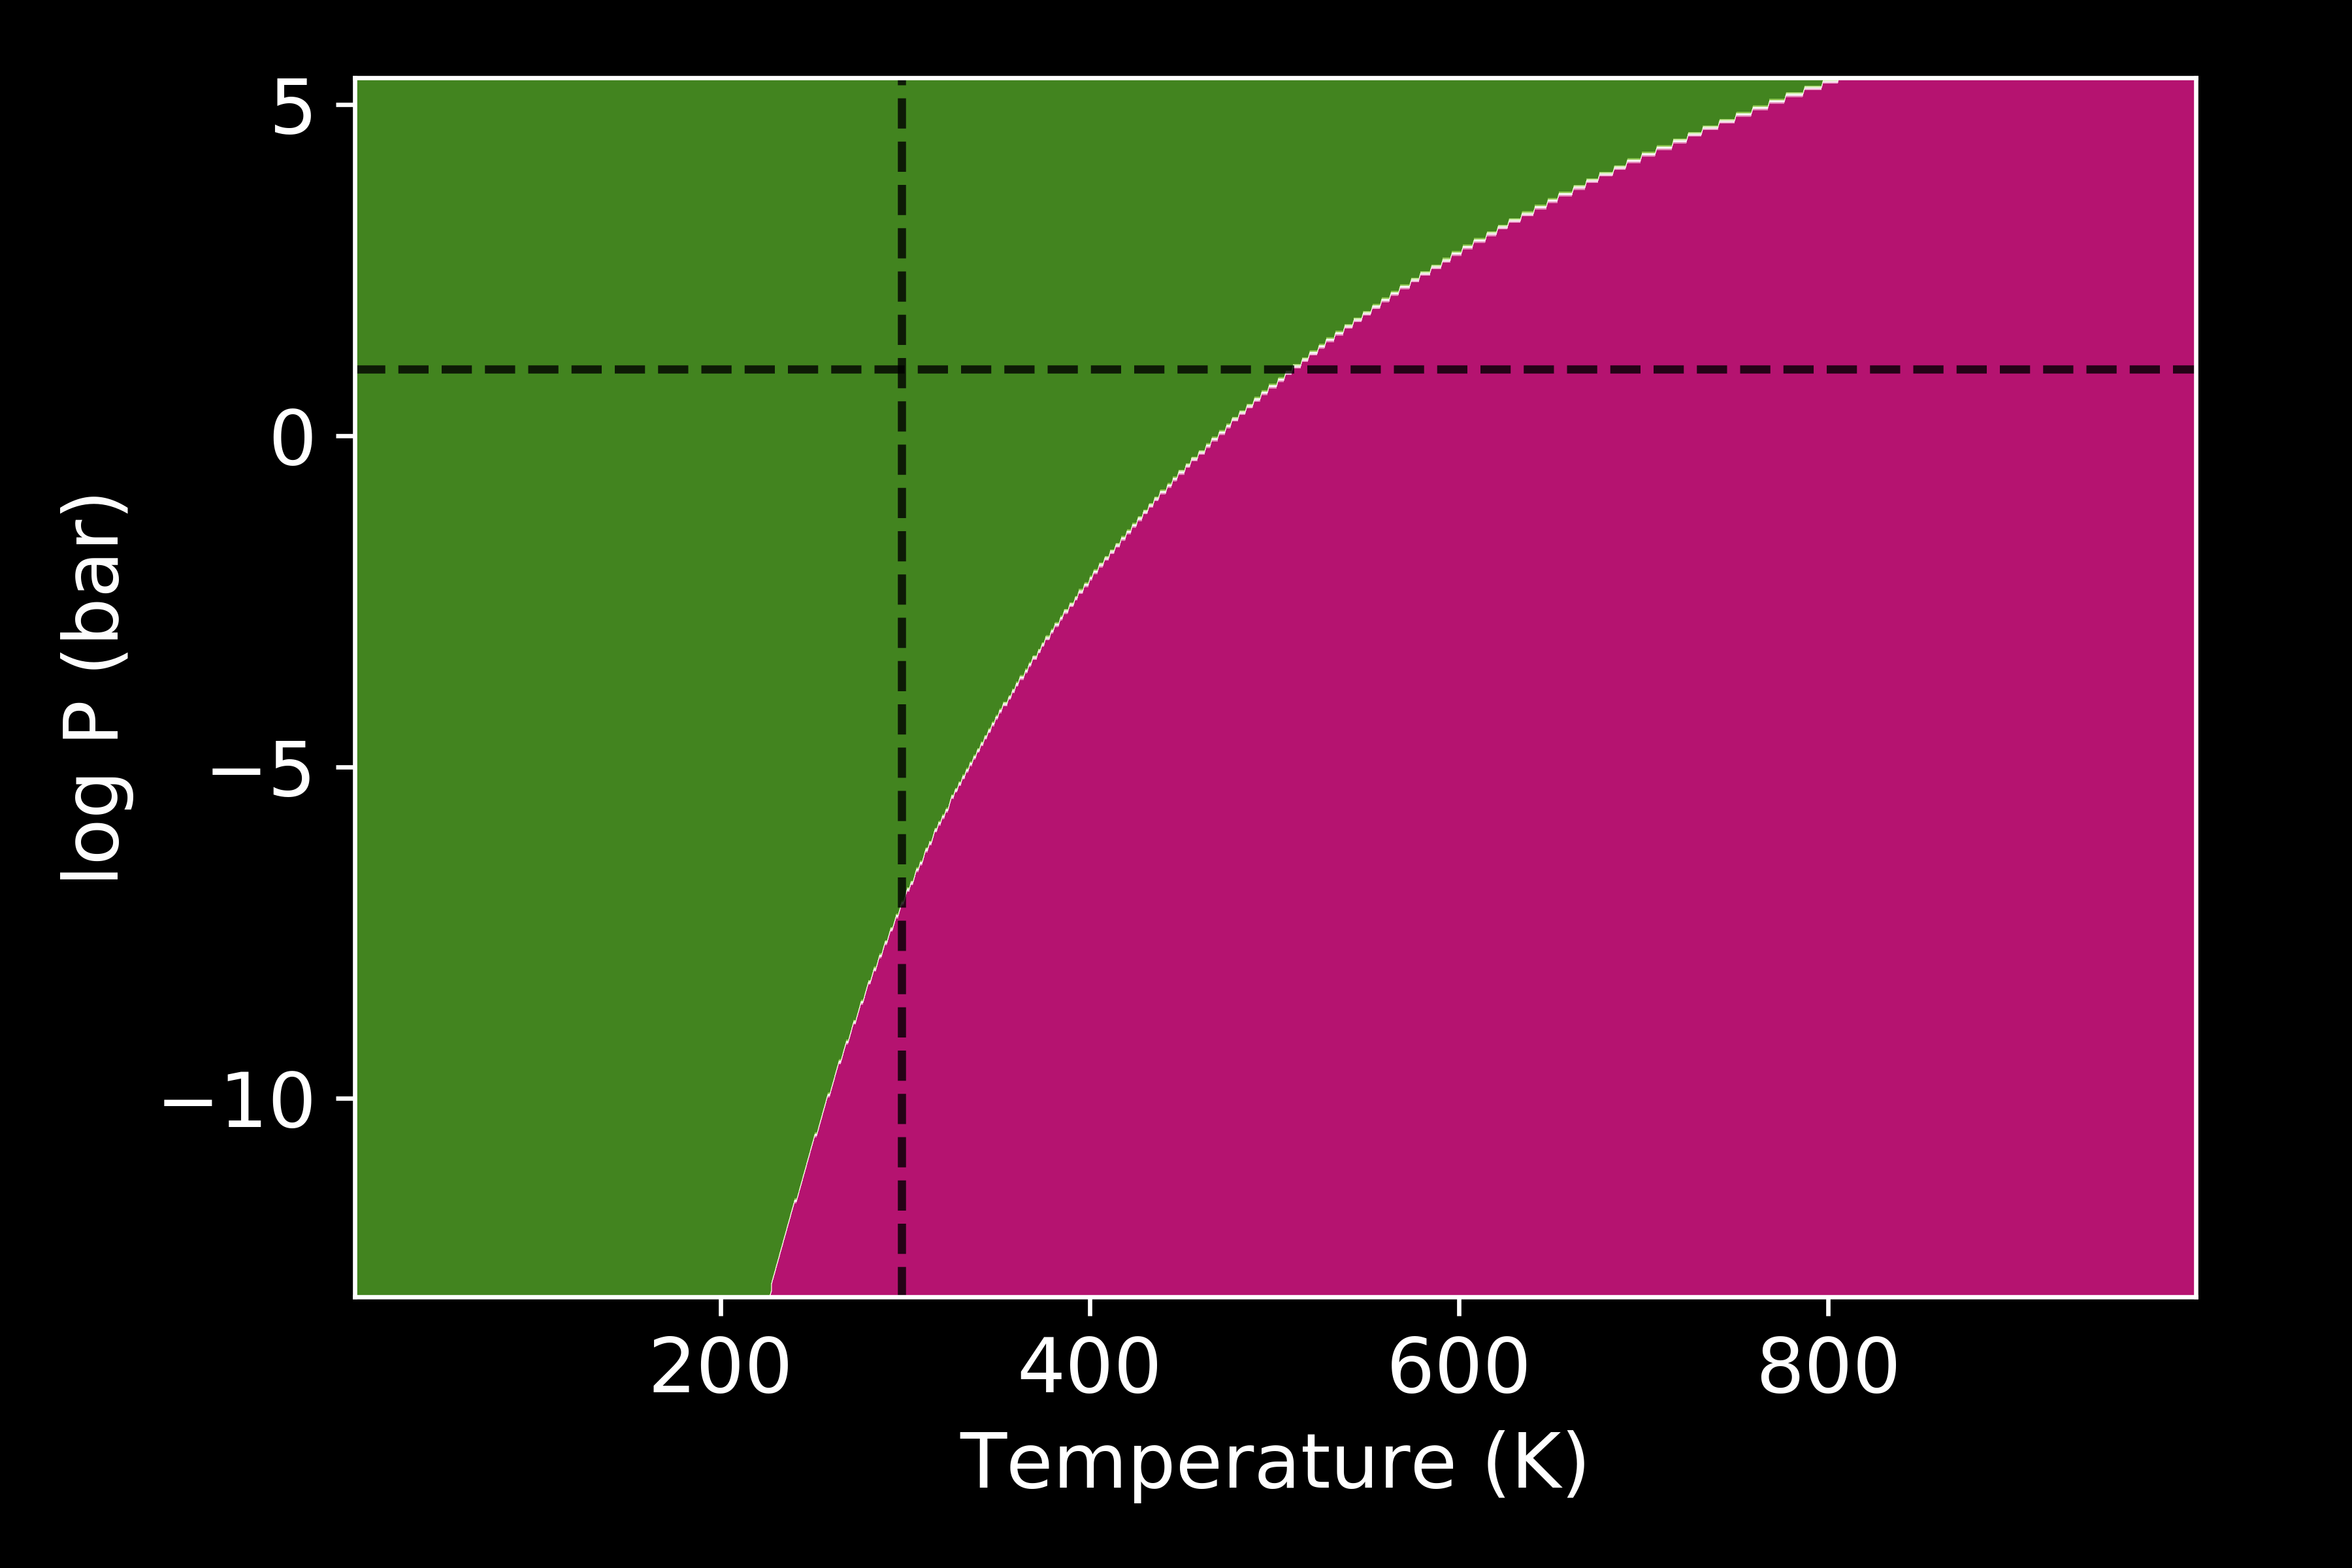
Alternatively you can also tweak the style
system.plot(output="dark_pvt.png",
            set_style="dark_background",
            colourmap="PiYG")