Gallery
The gallery is a preview of some of the plots available in surfinpy. Clicking on a plot will provide a link to a tutorial
for generating the plot.
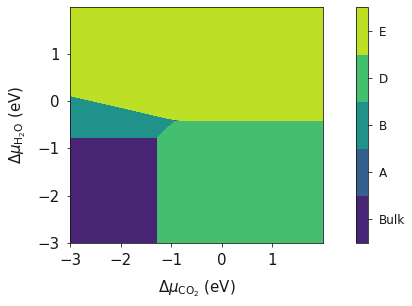
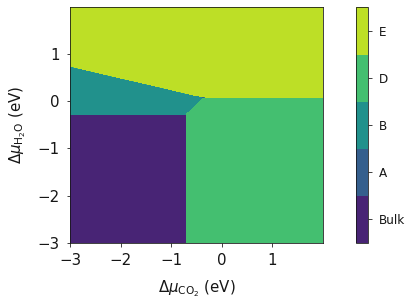
Surfaces
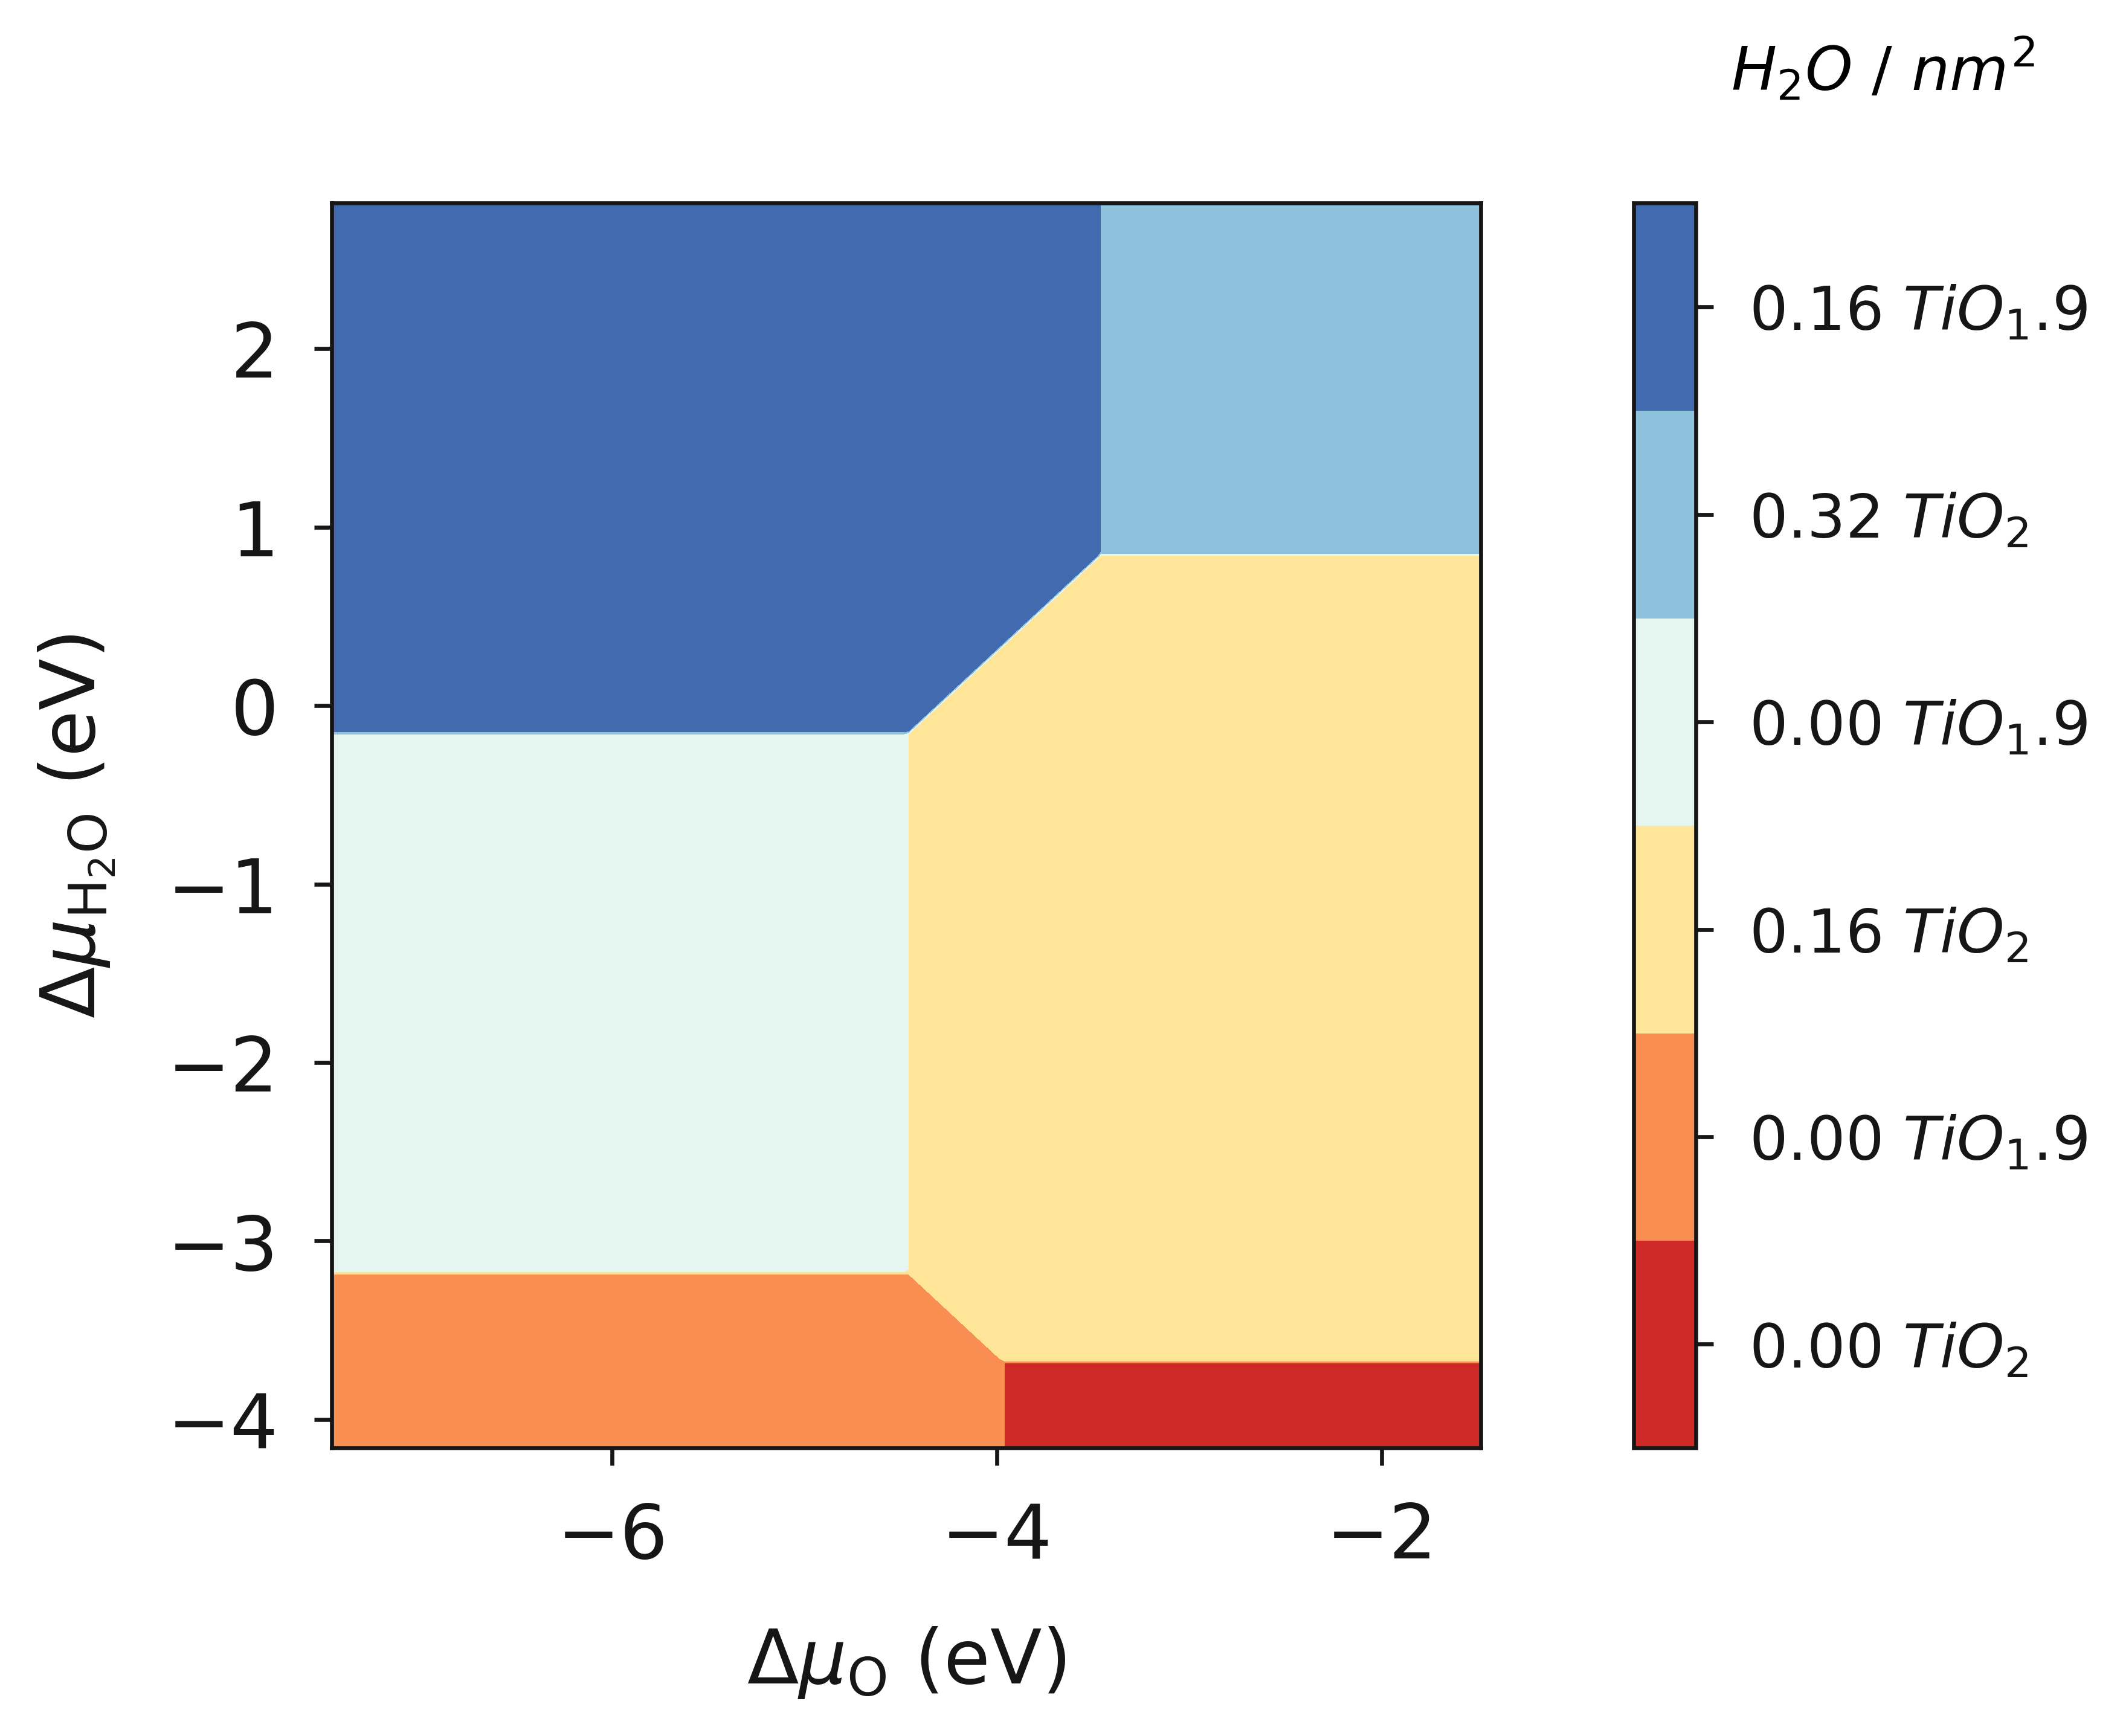
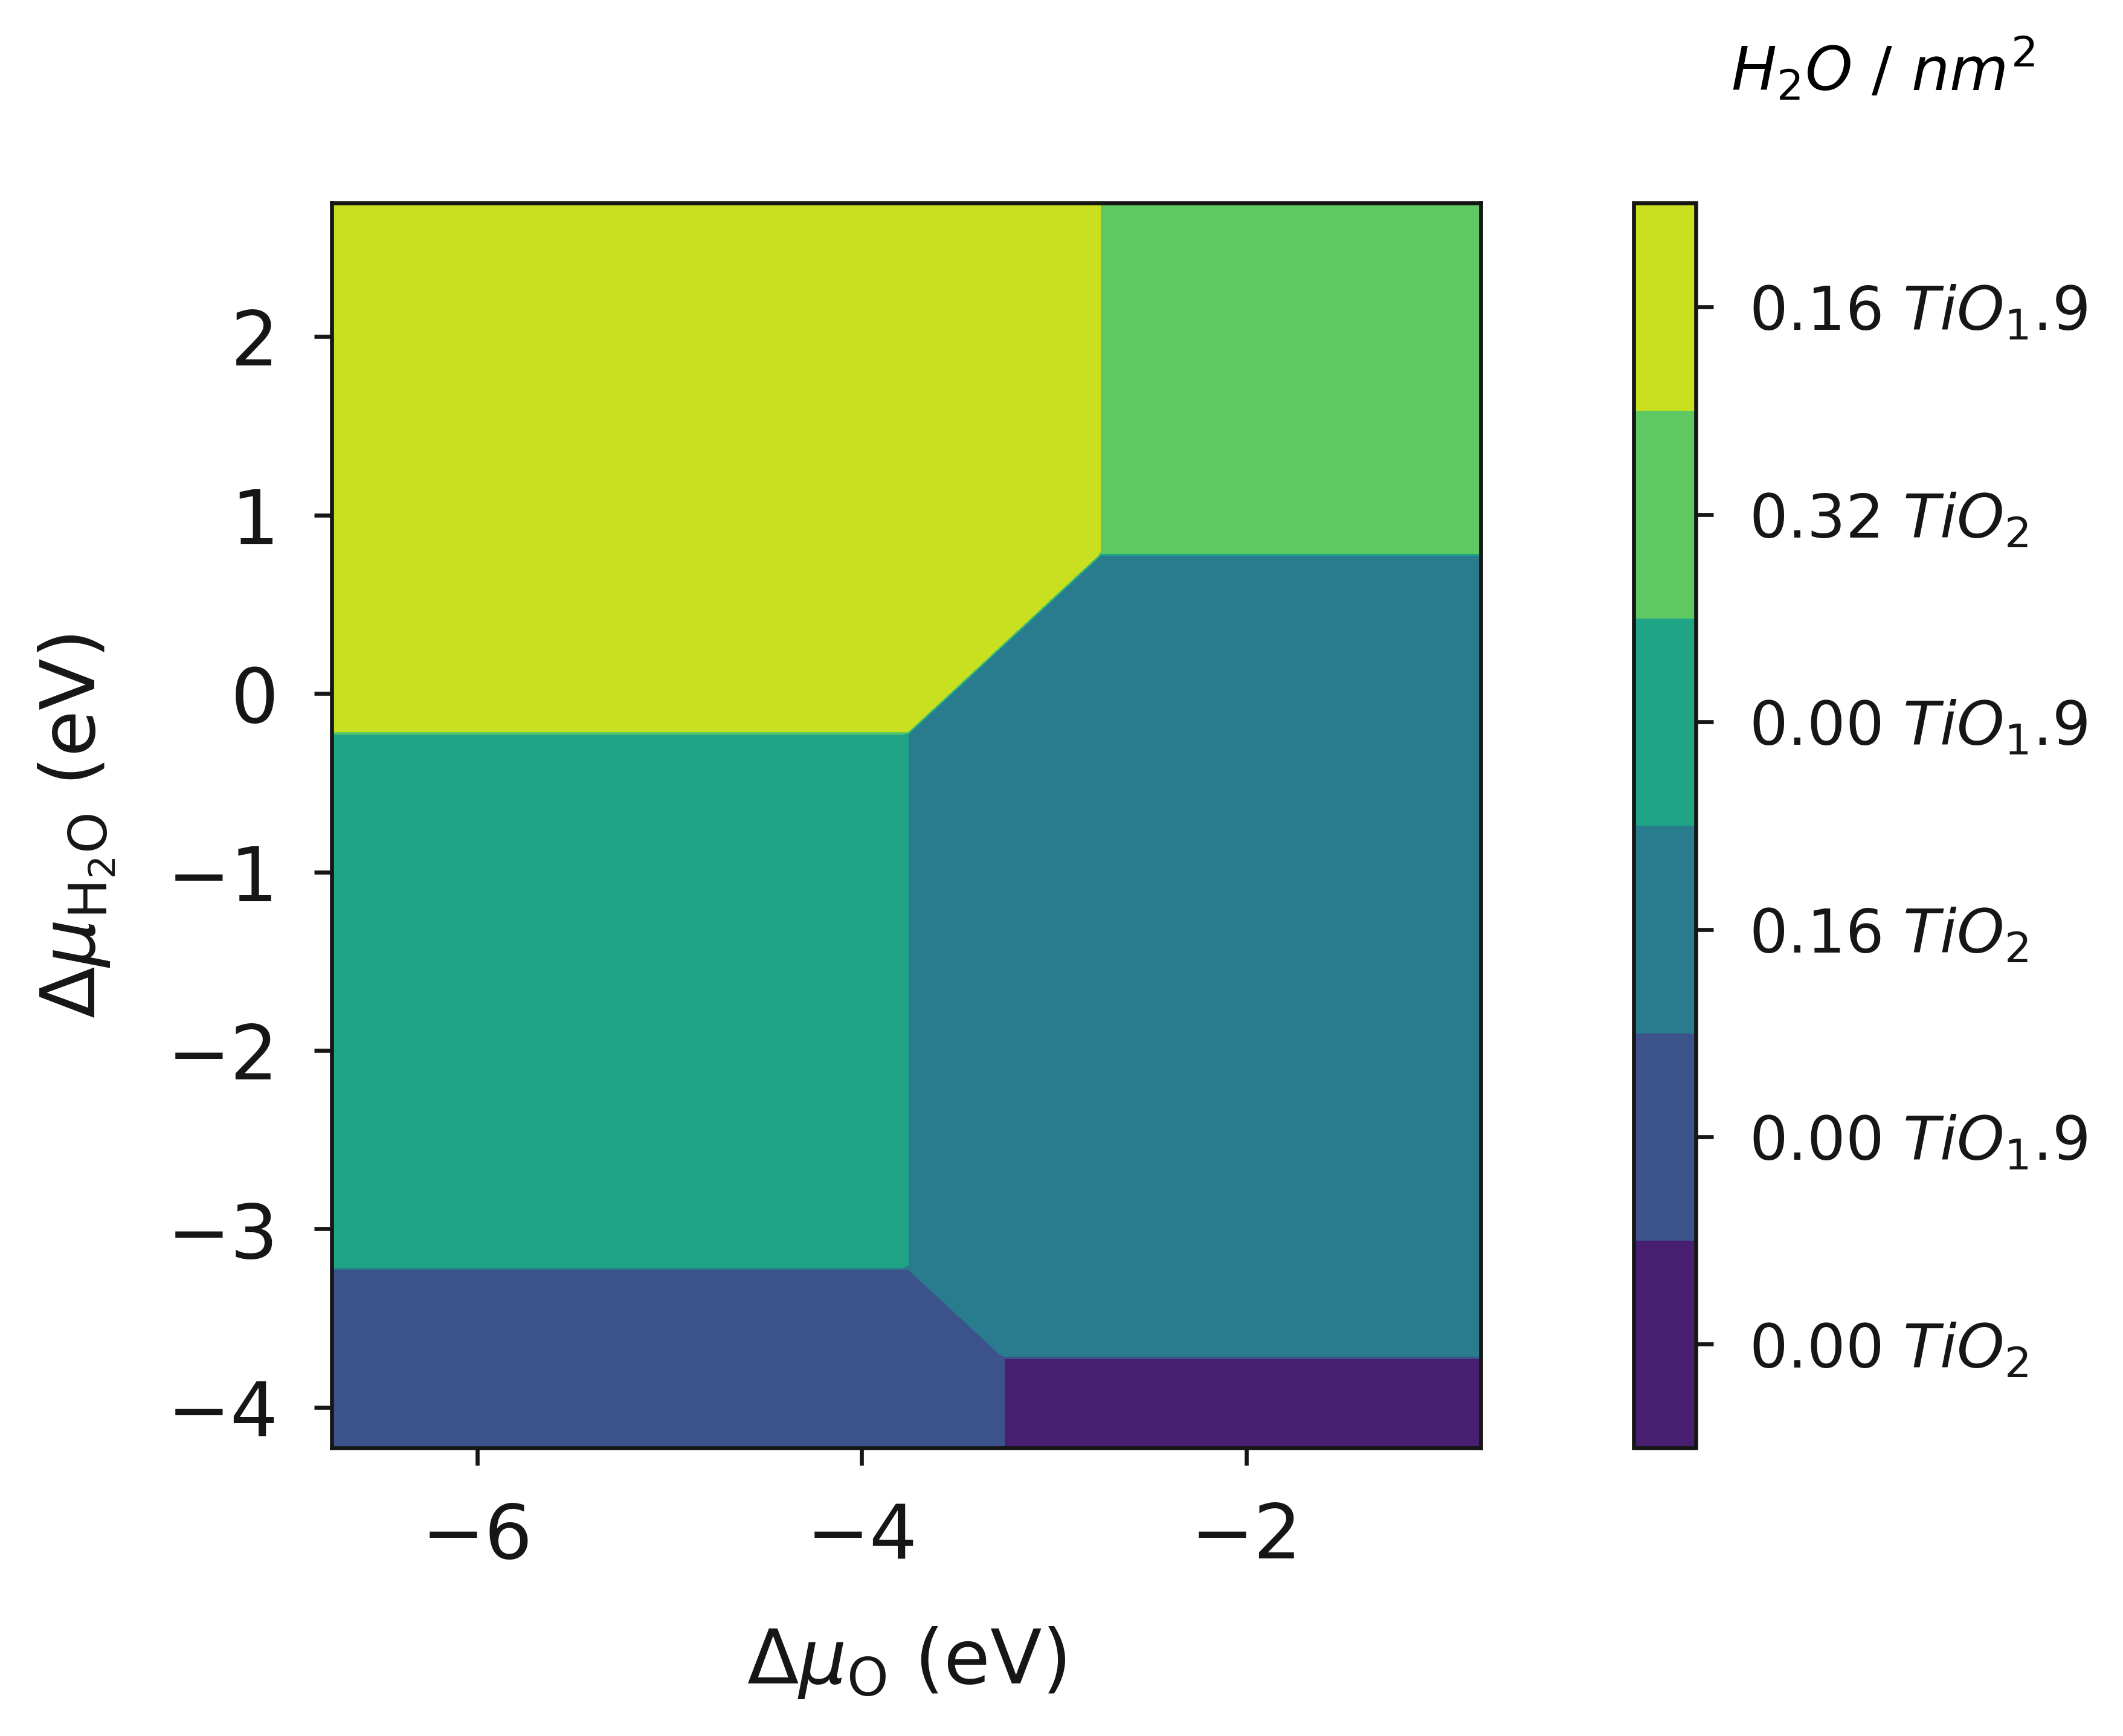
chemical potential
The following are examples of a phase diagram as a function of chemical potential. The first is the default output and the rest are generated by playing with the style and colourmap.
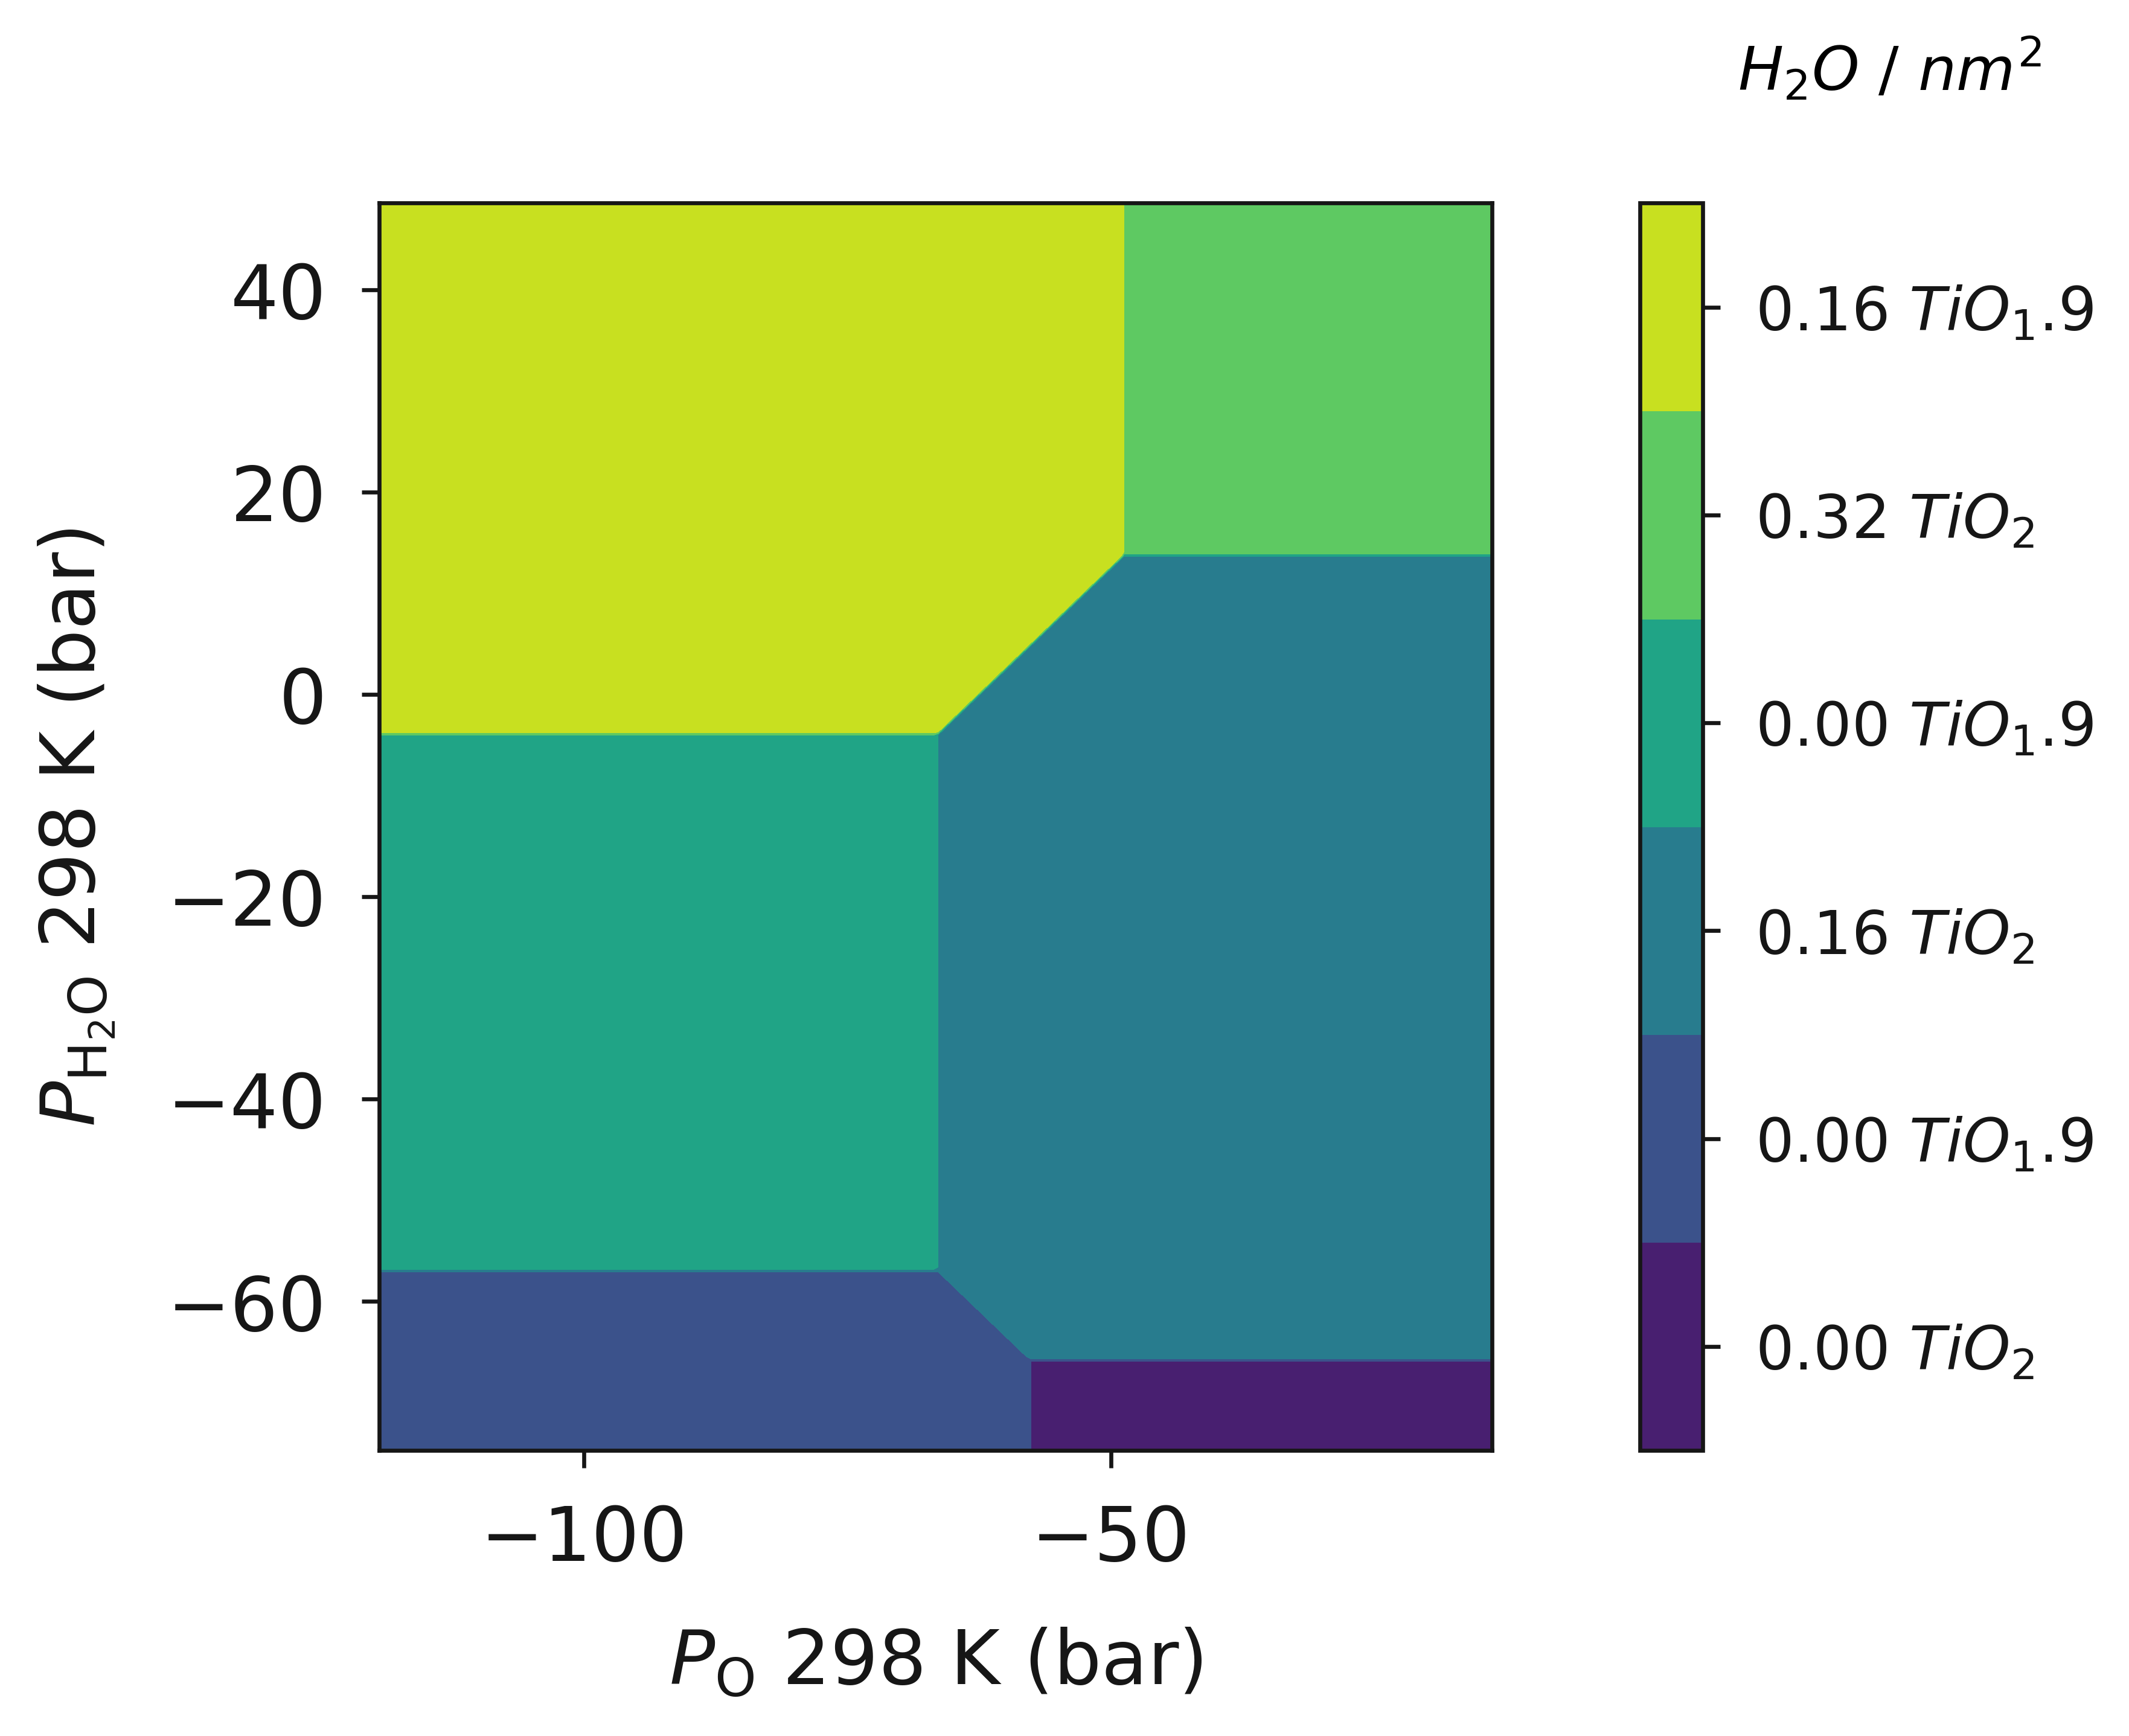
Pressure
Chemical potential can be converted to pressure and a diagram with pressure of species A/B displayed.
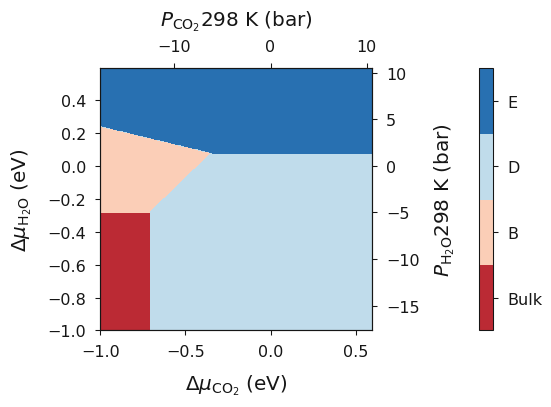
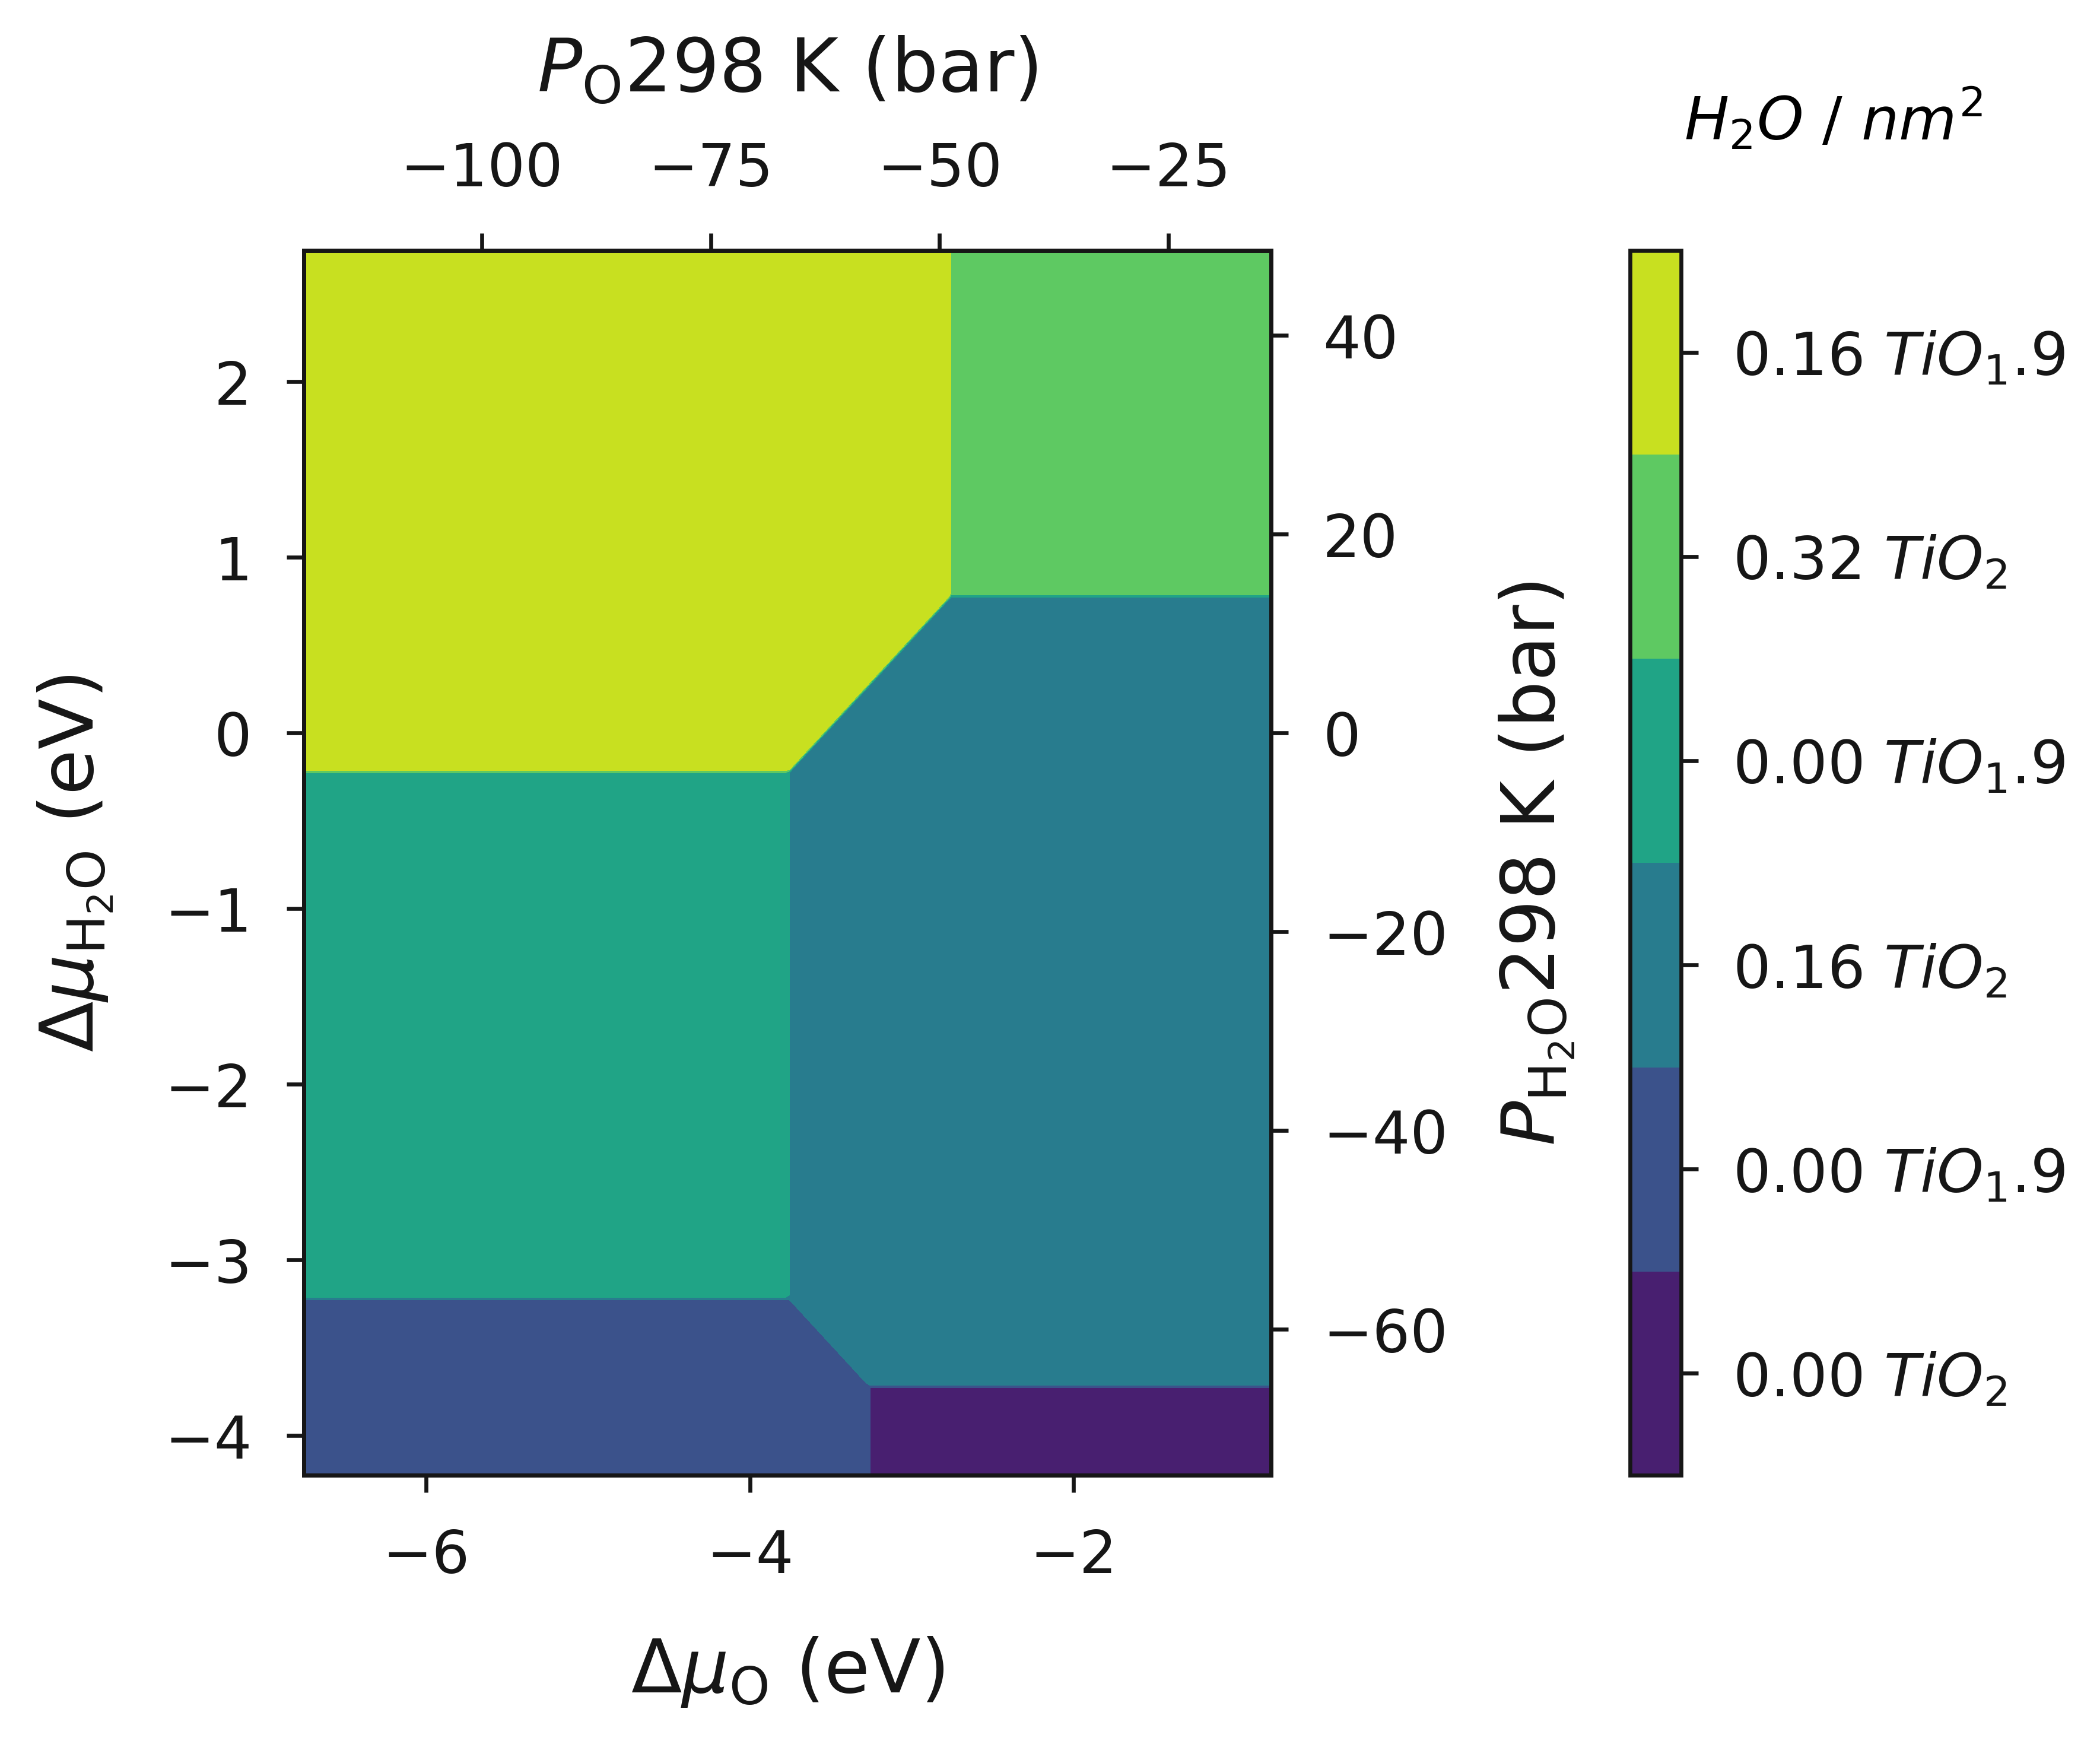
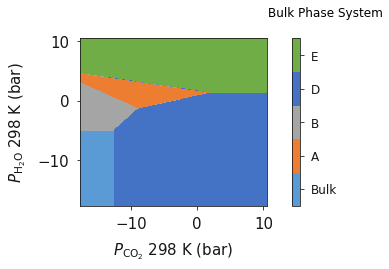
Chemical potential and pressure
surfinpy can produce a plot with the chemical potential of A/B on axes X/Y and the pressure of A/B on axes X2/Y2.
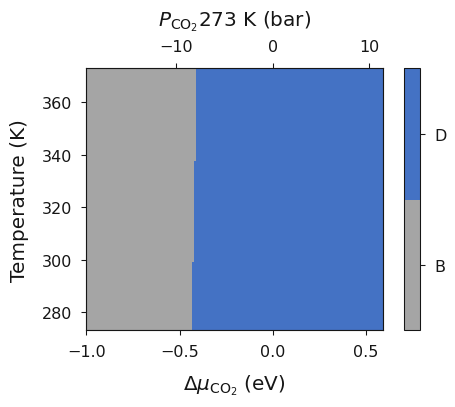
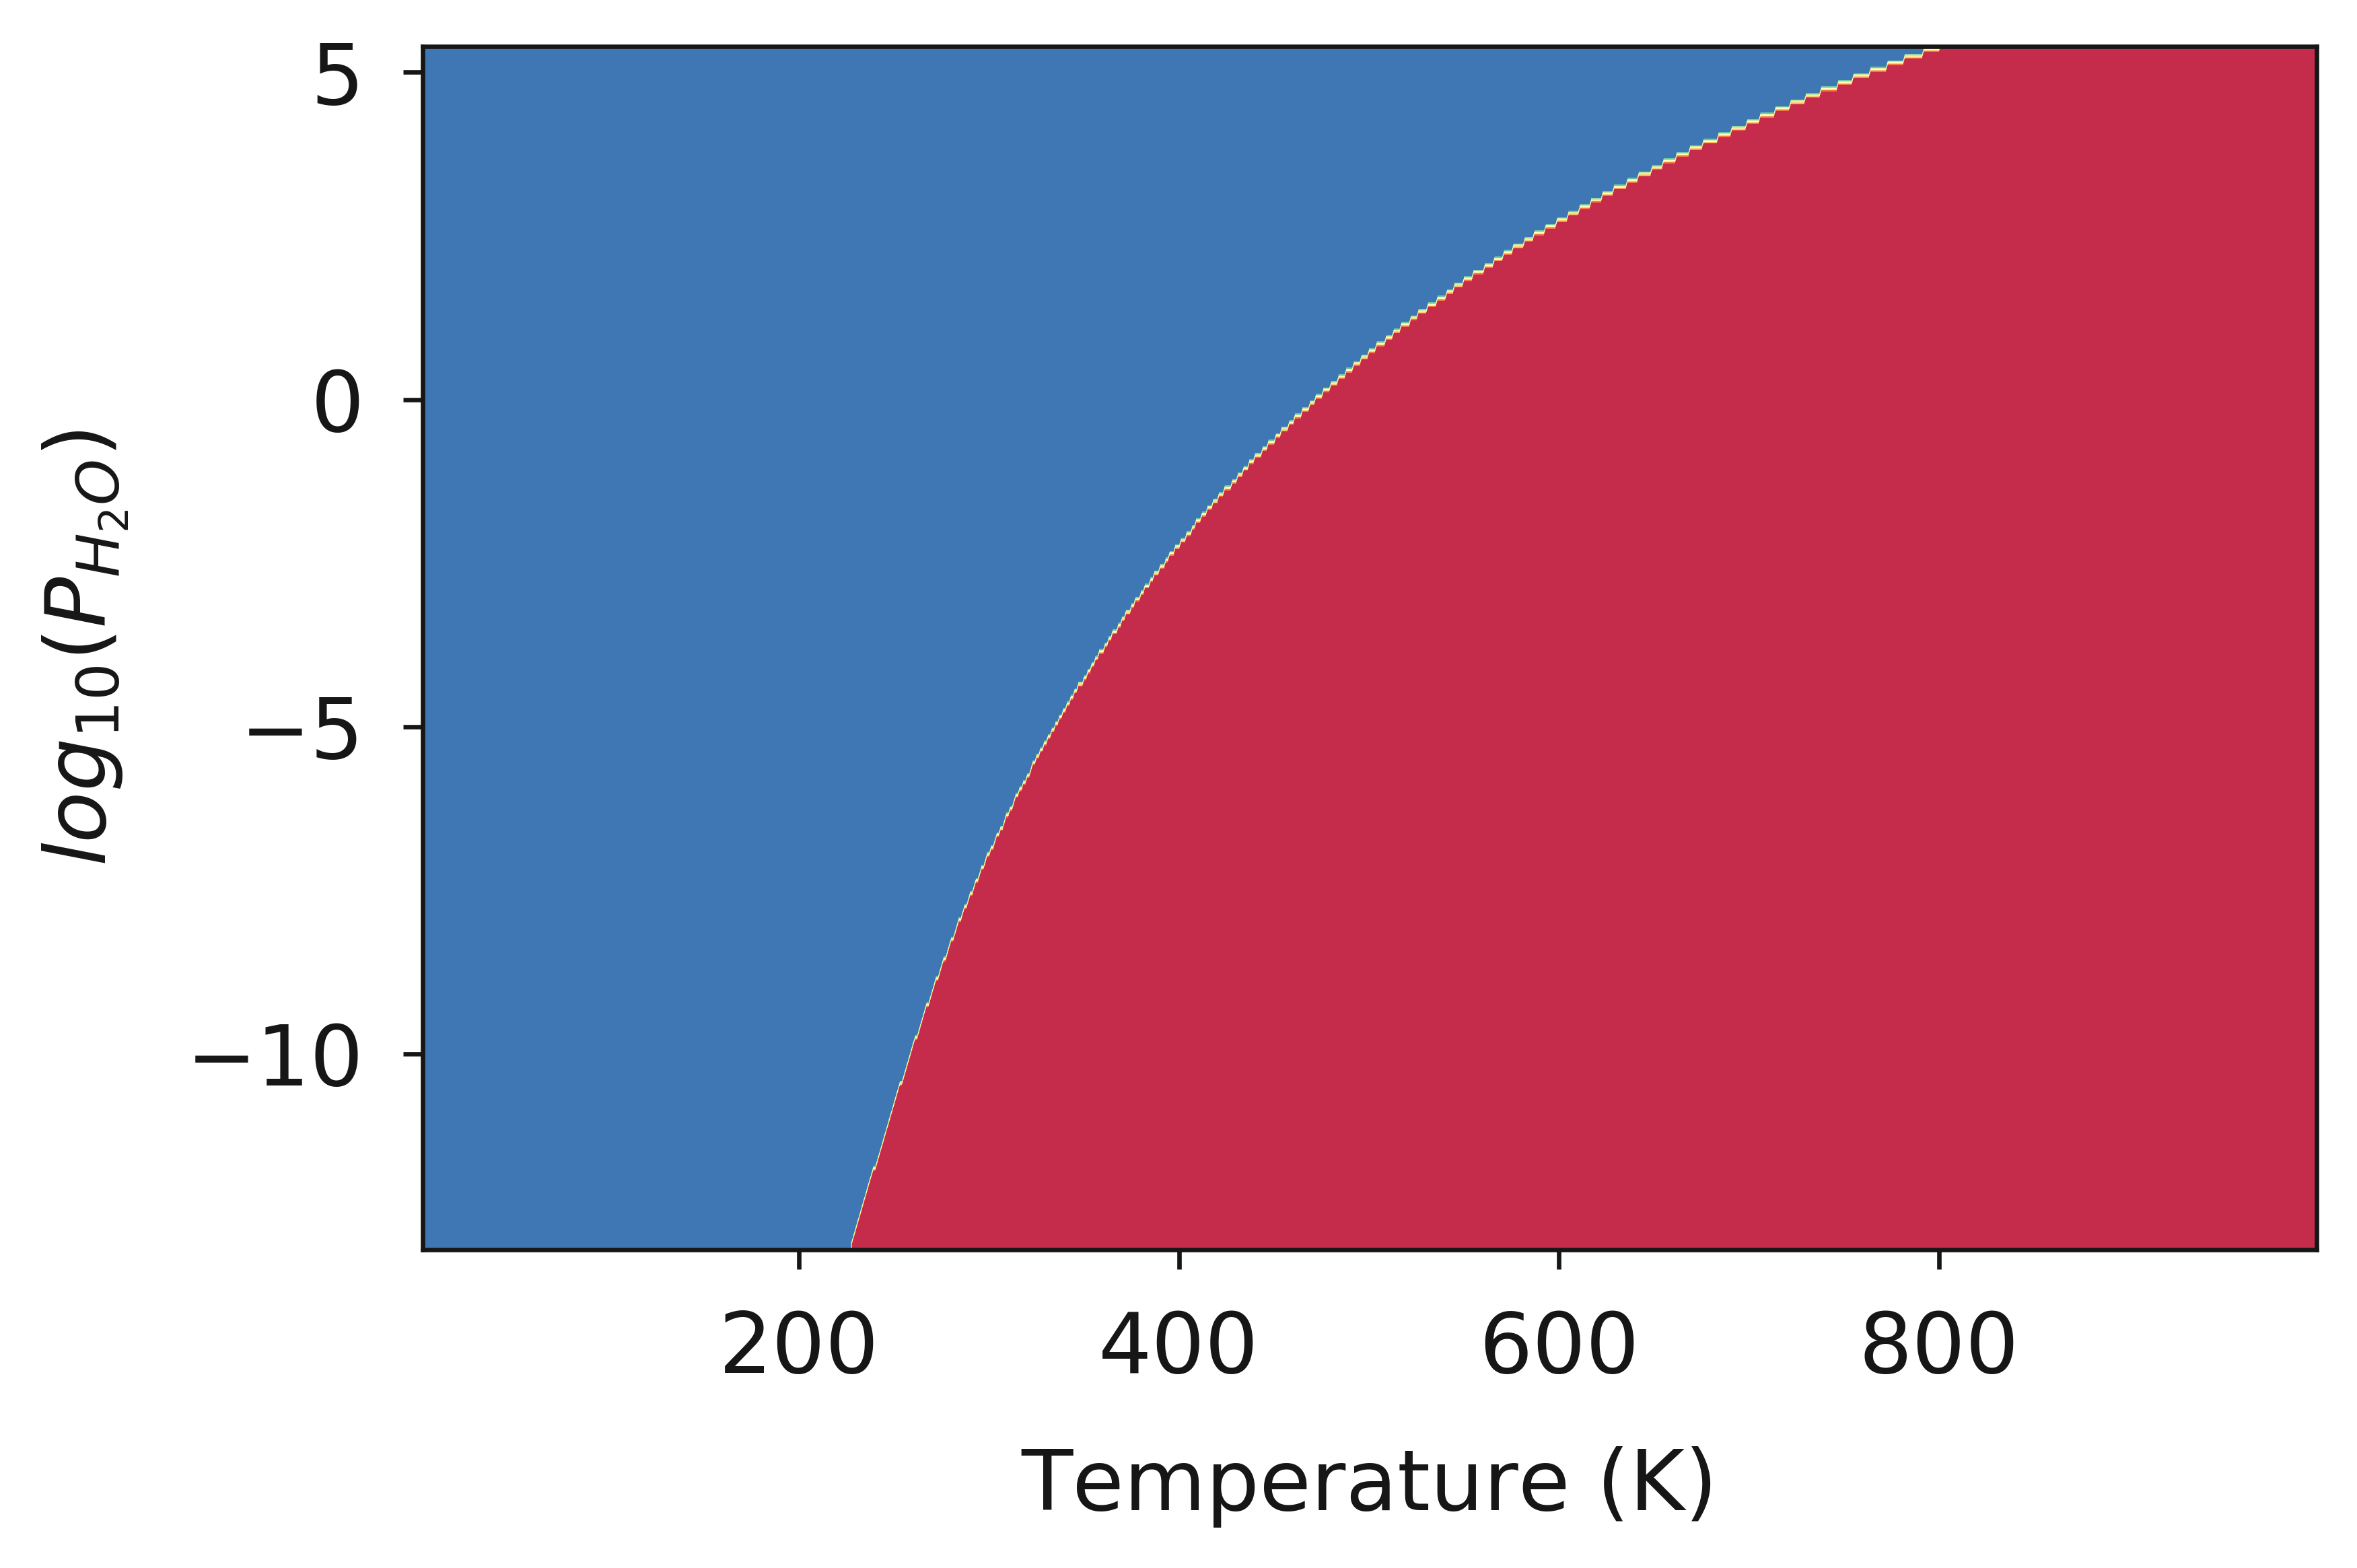
Temperature vs Pressure
surfinpy can produce simple pvt plots showing the relationship between a single species “A” at the surface e.g. water.
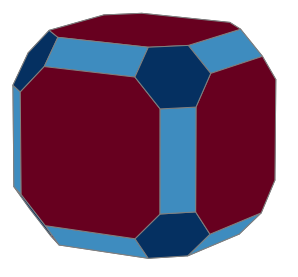
Particle Morphology
surfinpy provides examples of how to use the surface energy calculation alongside pymatgen to generate particle morphologies at different temperature and pressure values.
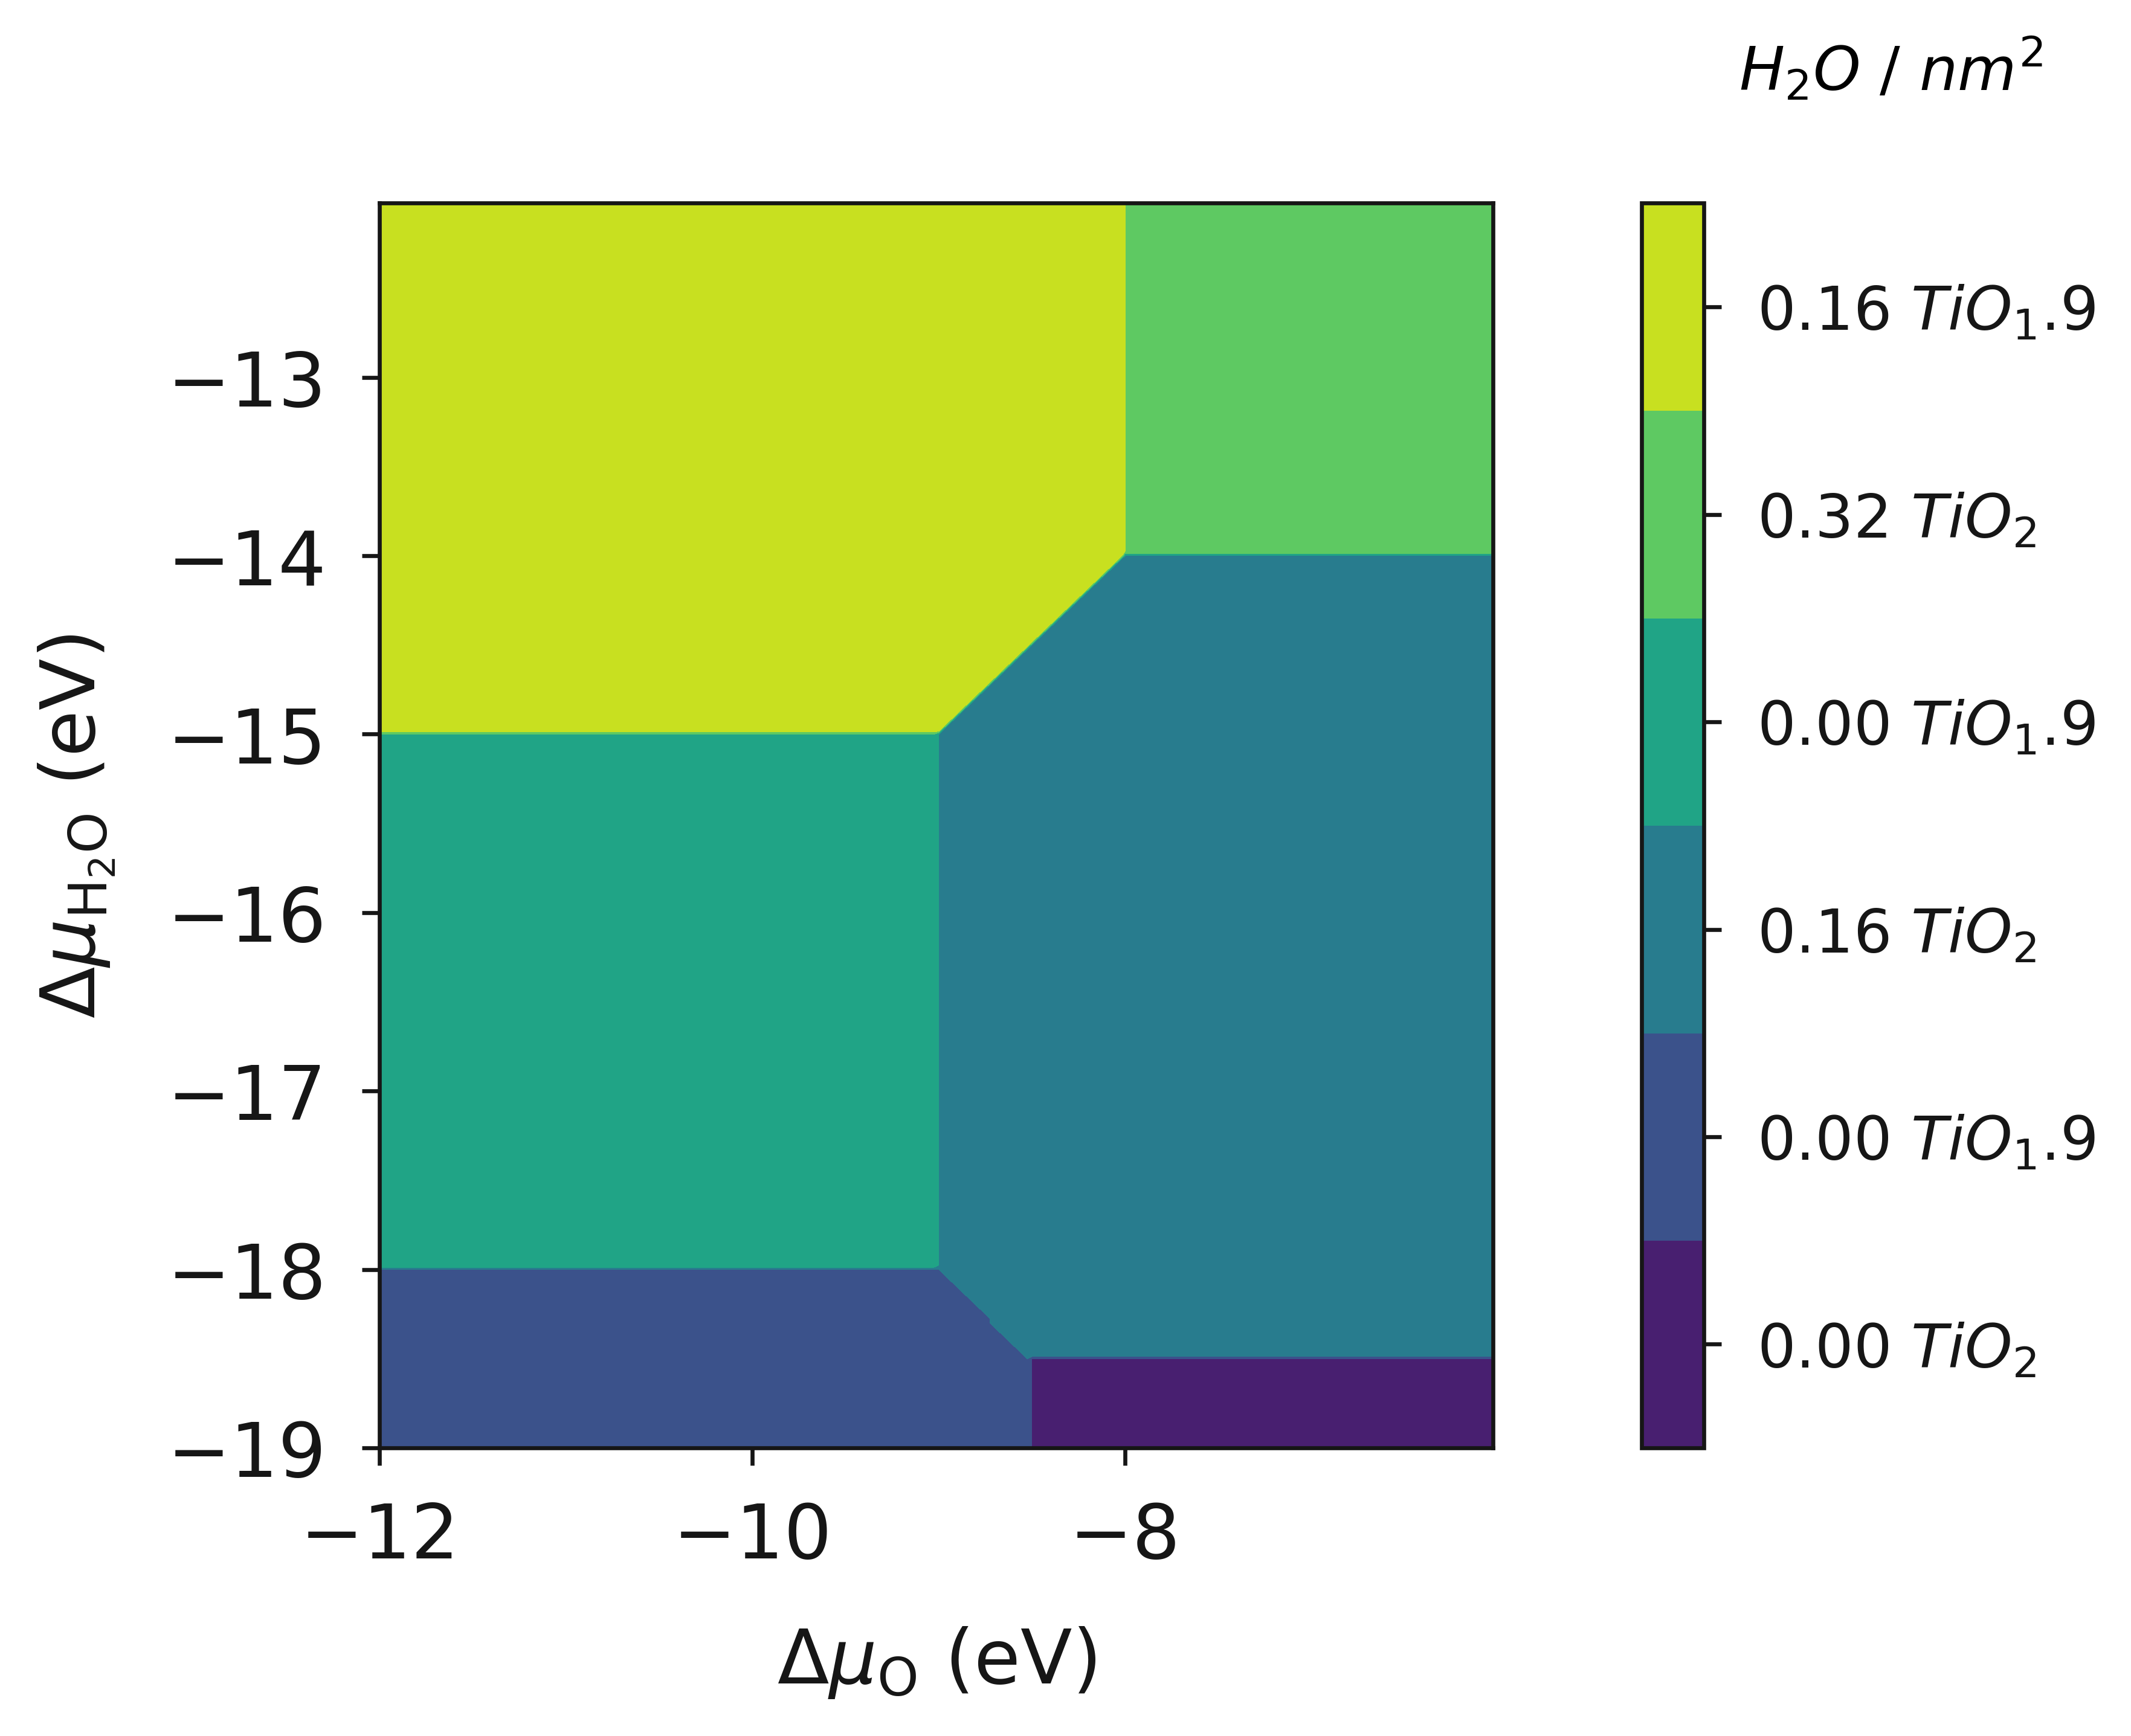
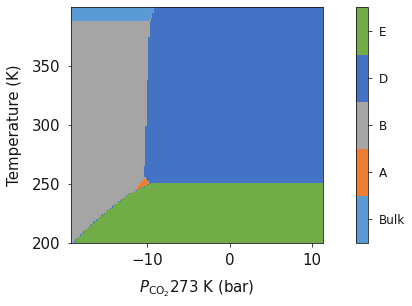
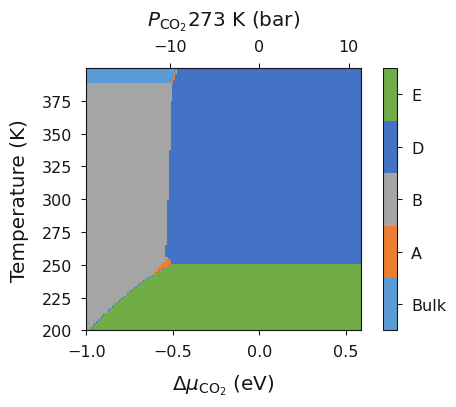
Bulk
Chemical Potential
The following are examples of a phase diagram as a function of chemical potential.
Temperature
The following are examples of a phase diagram as a function of chemical potential with a temperature contribution introduced.
Pressure
The following are examples of a phase diagram as a function of pressure.
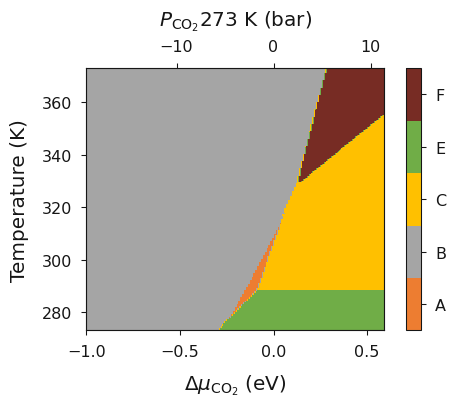
Pressure vs Temperature
The following are examples of a phase diagram as a function of chemical potential, chemical potential and pressure, and temperature.
Vibrational Entropy
The following are examples of how to include the effects of vibrational entropy to the phase diagrams.